Iowa State total enrollment is approximately 31,822 students. 25,271 are undergraduates and 3,031 are graduate students.
Male/Female Breakdown of Undergraduates
The full-time Iowa State undergraduate population is made up of 44% women, and 56% men.

For the gender breakdown for all students, go here.
Iowa State Racial/Ethnic Breakdown of Undergraduates

| Race/Ethnicity | Number |
|---|---|
| White | 19,454 |
| Hispanic | 1,631 |
| Asian | 981 |
| International | 952 |
| Unknown | 825 |
| Multi-Ethnic | 732 |
| Black or African American | 640 |
| Native Hawaiian or Pacific Islander | 16 |
See racial/ethnic breakdown for all students.
Male/Female Breakdown of Graduate Students
About 52% of full-time grad students are women, and 48% men.

For the gender breakdown for all students, go here.
Iowa State Racial-Ethnic Breakdown of Graduate Students

| Race/Ethnicity | Number |
|---|---|
| White | 1,529 |
| International | 1,036 |
| Unknown | 148 |
| Hispanic | 110 |
| Asian | 78 |
| Black or African American | 77 |
| Multi-Ethnic | 42 |
| Native Hawaiian or Pacific Islander | 2 |
See racial/ethnic breakdown for all students.

| Race/Ethnicity | Number |
|---|---|
| White | 23,124 |
| International | 2,592 |
| Hispanic | 1,951 |
| Asian | 1,189 |
| Unknown | 1,182 |
| Black or African American | 867 |
| Multi-Ethnic | 837 |
| Native Hawaiian or Pacific Islander | 24 |

There are approximately 14,153 female students and 17,669 male students at Iowa State.
Iowa State ranks 363 out of 2,183 when it comes to geographic diversity.
43.1% of Iowa State students come from out of state, and 5.12% come from out of the country.

The undergraduate student body is split among 41 states (may include Washington D.C.). Click on the map for more detail.
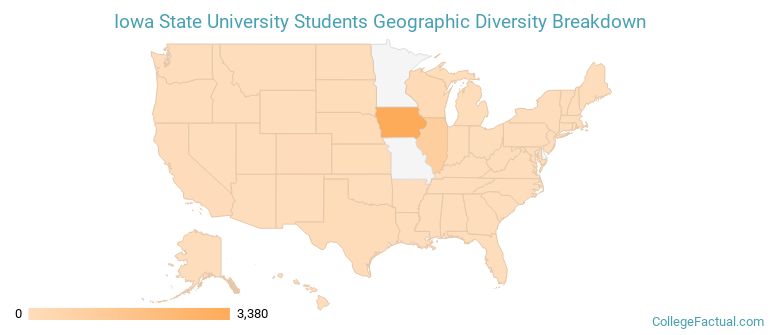
| State | Amount |
|---|---|
| Iowa | 3,380 |
| Illinois | 1,017 |
| Wisconsin | 200 |
| Nebraska | 83 |
| Texas | 61 |
Students from 120 countries are represented at this school, with the majority of the international students coming from China, India, and Malaysia.
Learn more about international students at Iowa State.
A traditional college student is defined as being between the ages of 18-21. At Iowa State, 66.17% of students fall into that category, compared to the national average of 60%.
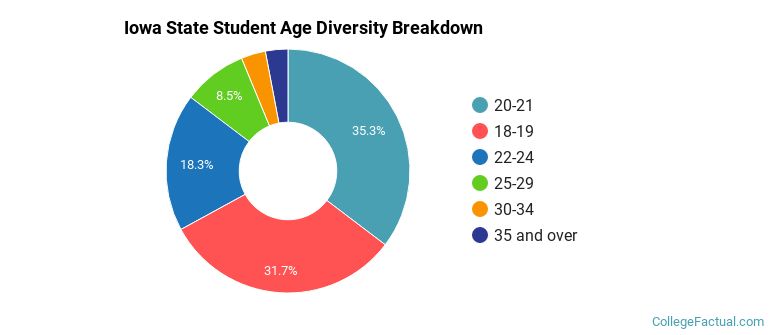
| Student Age Group | Amount |
|---|---|
| 20-21 | 12,607 |
| 18-19 | 11,320 |
| 22-24 | 6,519 |
| 25-29 | 3,021 |
| 30-34 | 1,156 |
| 35 and over | 1,065 |
| Under 18 | 0 |
Footnotes
*The racial-ethnic minorities count is calculated by taking the total number of students and subtracting white students, international students, and students whose race/ethnicity was unknown. This number is then divided by the total number of students at the school to obtain the racial-ethnic minorities percentage.
References
Department of Homeland Security Citizenship and Immigration Services
Learn more about how College Factual creates their Diversity Rankings.