College Factual recognizes the best colleges and universities in its annual rankings. These rankings include categories for best overall colleges, best colleges for each major, best value schools, and much more.
Joliet Junior College was awarded 2 badges in the 2025 rankings. The highest ranked major at the school is veterinary/animal health technologies/technicians.
Explore the best ranked schools for the programs you are most interested in.
Joliet Junior College is ranked #1,382 out of 2,152 schools in the nation for overall quality on College Factual's 2025 Best Colleges list.
Out of the 85 colleges in Illinois, Joliet Junior College is ranked at #55.
Since Joliet Junior College has an open admissions policy, being accepted to the school isn't that hard. However, a full basic things - such as a high school diploma or equivalent - may be required. Also, go over your application to make sure it is complete before you submit it.
The student to faculty ratio is often used to estimate how much interaction there is between professors and their students at a college or university. At Joliet Junior College, this ratio is 15 to 1, which is on par with the national average of 15 to 1. That's not bad at all.
In addition to the student to faculty ratio, some people look at what percentage of faculty members are full-time as a sign of how much time professors will be able to spend with their students. This is because part-time teachers may not be be on campus as much as their full-time counterparts.
The full-time faculty percentage at Joliet Junior College is 28%. This is lower than the national average of 47%.
The freshmen retention rate is a sign of how many full-time students like a college or university well enough to come back for their sophomore year. At Joliet Junior College this rate is 57%, which is a bit lower than the national average of 68%.
During the 2017-2018 academic year, there were 10,267 undergraduates at Joliet Junior College with 3,915 being full-time and 6,352 being part-time.
| $0-30 K | $30K-48K | $48-75 | $75-110K | $110K + |
|---|---|---|---|---|
| $2,593 | $1,875 | $4,282 | $7,347 | $7,908 |
The net price is calculated by adding tuition, room, board and other costs and subtracting financial aid.Note that the net price is typically less than the published for a school. For more information on the sticker price of Joliet Junior College, see our tuition and fees and room and board pages.
Almost 66% of college students who graduated with the class of 2018 took out student loans, but that percentage varies from school to school. At Joliet Junior College, approximately 5% of students took out student loans averaging $4,761 a year. That adds up to $19,044 over four years for those students.
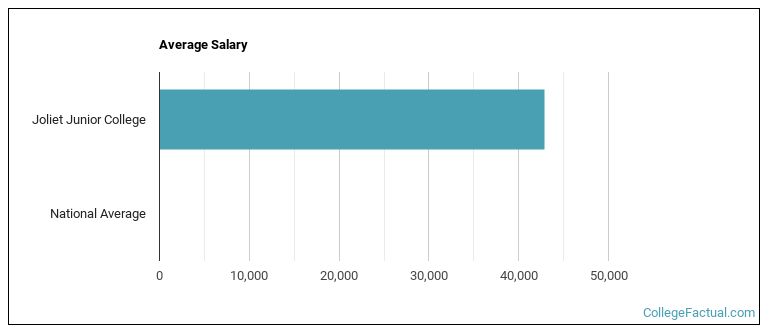
See which majors at Joliet Junior College make the most money.
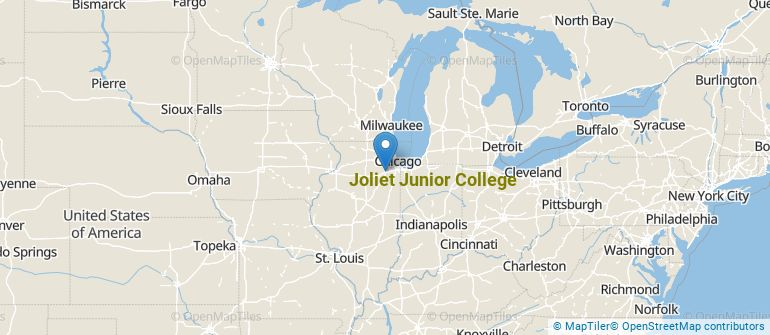
Get more details about the location of Joliet Junior College.
Contact details for Joliet Junior College are given below.
| Contact Details | |
|---|---|
| Address: | 1215 Houbolt Rd, Joliet, IL 60431-8938 |
| Phone: | 815-729-9020 |
| Website: | www.jjc.edu/ |
| Most Popular Majors | Bachelor’s Degrees | Average Salary of Graduates |
|---|---|---|
| Liberal Arts General Studies | 662 | NA |
| Business Administration & Management | 266 | NA |
| Computer Systems Networking | 191 | NA |
| Vehicle Maintenance & Repair | 166 | NA |
| Precision Metal Working | 151 | NA |
| Electromechanical Engineering Technology | 145 | NA |
| Culinary Arts | 143 | NA |
| Biological & Physical Science | 142 | NA |
| Electronics Maintenance & Repair | 97 | NA |
| Nursing | 87 | NA |
Online learning options are becoming more and more popular at American colleges and universities. Online classes are great for students who have busy schedules or for those who just want to study on their own time.
In 2022-2023, 4,935 students took at least one online class at Joliet Junior College. This is a decrease from the 7,437 students who took online classes the previous year.
| Year | Took at Least One Online Class | Took All Classes Online |
|---|---|---|
| 2022-2023 | 4,935 | 2,243 |
| 2021-2022 | 7,437 | 4,197 |
| 2020-2021 | 9,885 | 8,102 |
| 2018-2019 | 3,429 | 1,059 |
Footnotes
*The racial-ethnic minorities count is calculated by taking the total number of students and subtracting white students, international students, and students whose race/ethnicity was unknown. This number is then divided by the total number of students at the school to obtain the racial-ethnic minorities percentage.
References
More about our data sources and methodologies.