Judson total enrollment is approximately 1,173 students. 856 are undergraduates and 183 are graduate students.
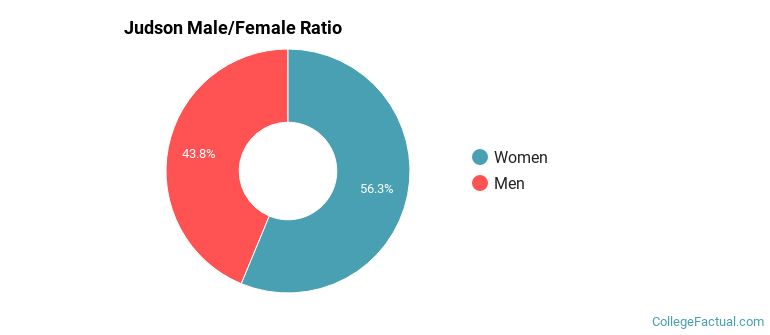
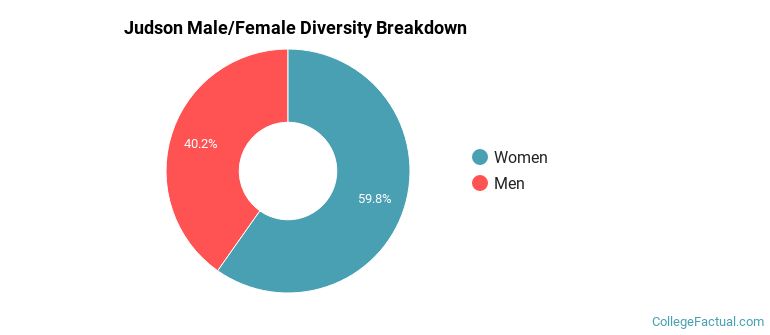
Male/Female Breakdown of Undergraduates
The full-time Judson undergraduate population is made up of 55% women, and 45% men.
For the gender breakdown for all students, go here.
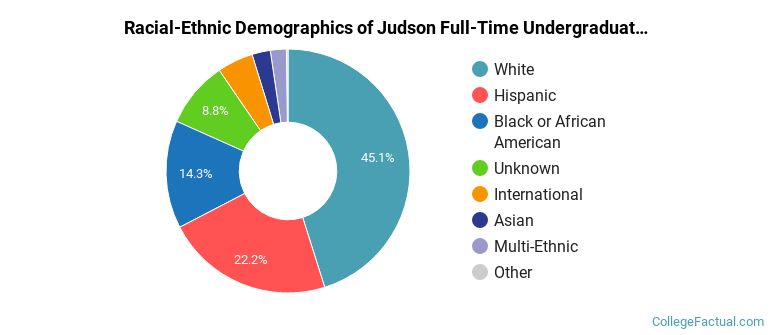
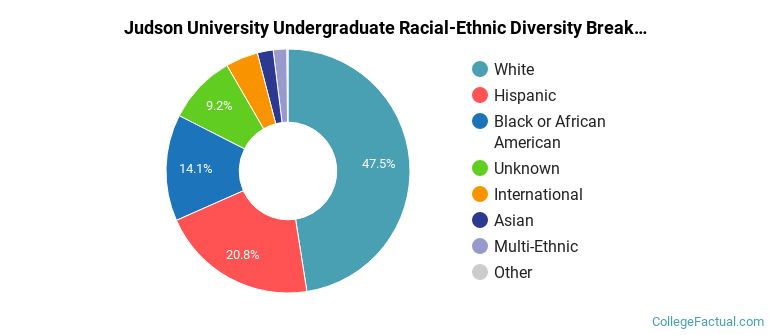
Judson Racial/Ethnic Breakdown of Undergraduates
| Race/Ethnicity | Number |
|---|---|
| White | 343 |
| Hispanic | 261 |
| Black or African American | 103 |
| Unknown | 70 |
| International | 43 |
| Asian | 19 |
| Multi-Ethnic | 13 |
| Native Hawaiian or Pacific Islander | 3 |
See racial/ethnic breakdown for all students.
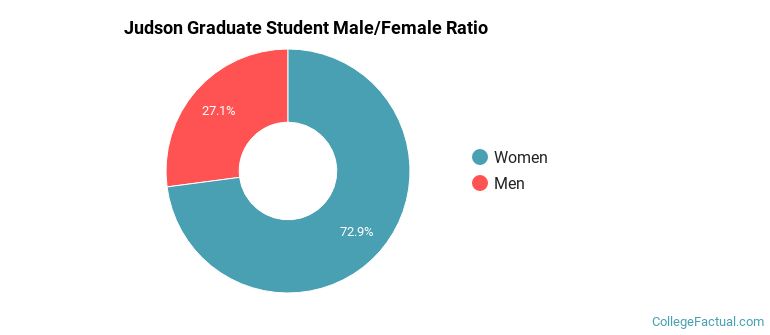
Male/Female Breakdown of Graduate Students
About 63% of full-time grad students are women, and 37% men.
For the gender breakdown for all students, go here.
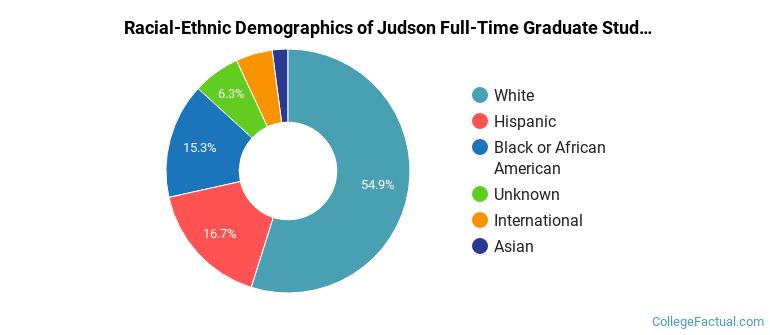
Judson Racial-Ethnic Breakdown of Graduate Students
| Race/Ethnicity | Number |
|---|---|
| White | 83 |
| International | 42 |
| Hispanic | 22 |
| Black or African American | 16 |
| Unknown | 14 |
| Asian | 3 |
| Multi-Ethnic | 2 |
| Native Hawaiian or Pacific Islander | 1 |
See racial/ethnic breakdown for all students.
| Race/Ethnicity | Number |
|---|---|
| White | 492 |
| Hispanic | 309 |
| Black or African American | 145 |
| Unknown | 93 |
| International | 87 |
| Asian | 25 |
| Multi-Ethnic | 17 |
| Native Hawaiian or Pacific Islander | 4 |
There are approximately 685 female students and 488 male students at Judson.
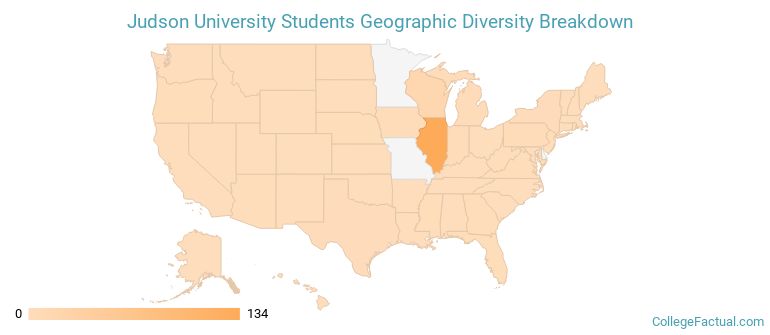
Judson ranks 946 out of 2,183 when it comes to geographic diversity.
24.29% of Judson students come from out of state, and 7.81% come from out of the country.
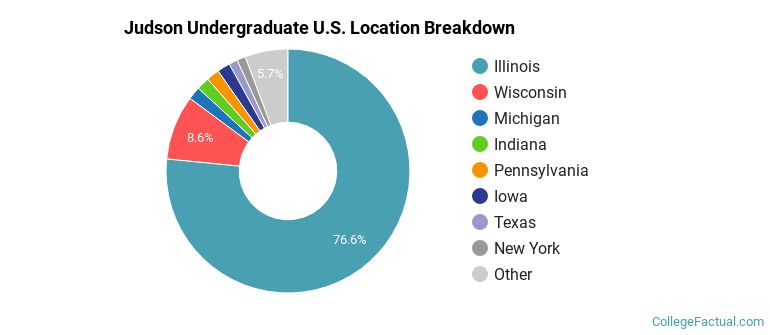
The undergraduate student body is split among 18 states (may include Washington D.C.). Click on the map for more detail.
| State | Amount |
|---|---|
| Illinois | 134 |
| Wisconsin | 15 |
| Iowa | 3 |
| Indiana | 3 |
| Michigan | 3 |
Students from 29 countries are represented at this school, with the majority of the international students coming from India, Brazil, and South Korea.
Learn more about international students at Judson.
A traditional college student is defined as being between the ages of 18-21. At Judson, 43.02% of students fall into that category, compared to the national average of 60%.
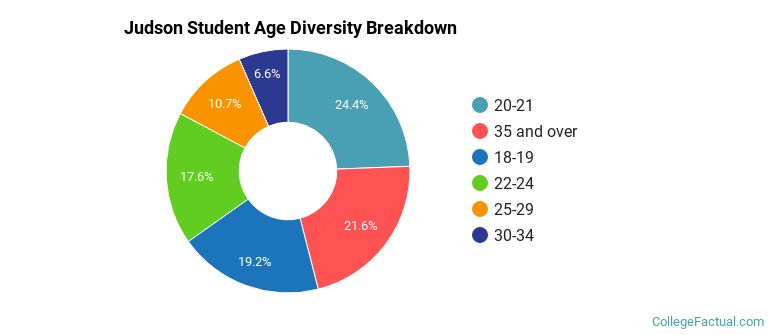
| Student Age Group | Amount |
|---|---|
| 20-21 | 309 |
| 35 and over | 274 |
| 18-19 | 243 |
| 22-24 | 223 |
| 25-29 | 135 |
| 30-34 | 83 |
| Under 18 | 0 |
Footnotes
*The racial-ethnic minorities count is calculated by taking the total number of students and subtracting white students, international students, and students whose race/ethnicity was unknown. This number is then divided by the total number of students at the school to obtain the racial-ethnic minorities percentage.
References
Department of Homeland Security Citizenship and Immigration Services
Image Credit: By User:Rammerjammer under License
Learn more about how College Factual creates their Diversity Rankings.