K -State total enrollment is approximately 20,854 students. 14,497 are undergraduates and 2,573 are graduate students.
Male/Female Breakdown of Undergraduates
The full-time K -State undergraduate population is made up of 48% women, and 52% men.

For the gender breakdown for all students, go here.
K -State Racial/Ethnic Breakdown of Undergraduates

| Race/Ethnicity | Number |
|---|---|
| White | 11,594 |
| Hispanic | 1,070 |
| Multi-Ethnic | 573 |
| International | 413 |
| Black or African American | 379 |
| Asian | 250 |
| Unknown | 144 |
| Native Hawaiian or Pacific Islander | 12 |
See racial/ethnic breakdown for all students.
Male/Female Breakdown of Graduate Students
About 59% of full-time grad students are women, and 41% men.

For the gender breakdown for all students, go here.
K -State Racial-Ethnic Breakdown of Graduate Students

| Race/Ethnicity | Number |
|---|---|
| White | 1,602 |
| International | 609 |
| Hispanic | 155 |
| Multi-Ethnic | 66 |
| Black or African American | 55 |
| Asian | 50 |
| Unknown | 26 |
| Native Hawaiian or Pacific Islander | 3 |
See racial/ethnic breakdown for all students.

| Race/Ethnicity | Number |
|---|---|
| White | 16,007 |
| Hispanic | 1,538 |
| International | 1,162 |
| Multi-Ethnic | 741 |
| Black or African American | 648 |
| Asian | 397 |
| Unknown | 249 |
| Native Hawaiian or Pacific Islander | 20 |

There are approximately 10,775 female students and 10,079 male students at K -State.
K -State ranks 624 out of 2,183 when it comes to geographic diversity.
18.71% of K -State students come from out of state, and 2.46% come from out of the country.

The undergraduate student body is split among 39 states (may include Washington D.C.). Click on the map for more detail.
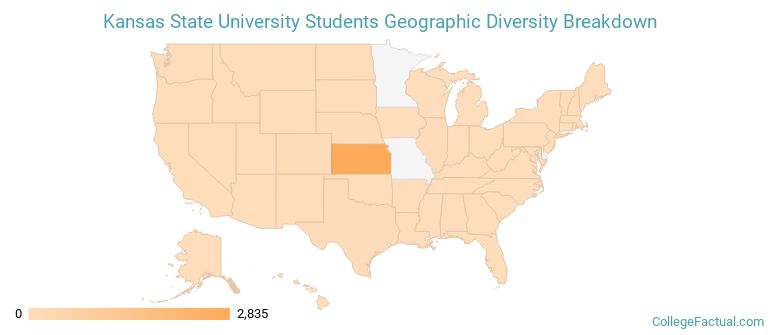
| State | Amount |
|---|---|
| Kansas | 2,835 |
| Texas | 78 |
| Nebraska | 72 |
| Colorado | 54 |
| Illinois | 39 |
Students from 108 countries are represented at this school, with the majority of the international students coming from China, Saudi Arabia, and India.
Learn more about international students at K -State.
A traditional college student is defined as being between the ages of 18-21. At K -State, 58.70% of students fall into that category, compared to the national average of 60%.
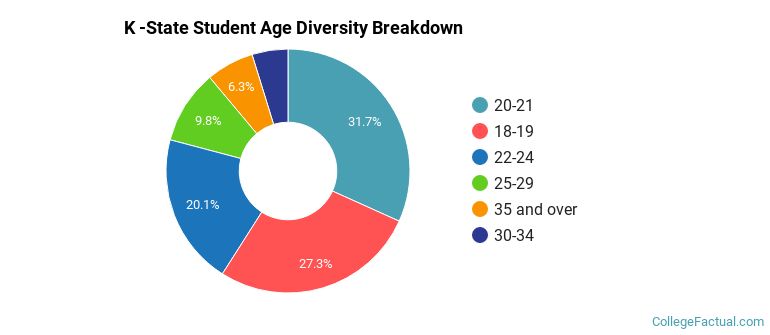
| Student Age Group | Amount |
|---|---|
| 20-21 | 7,195 |
| 18-19 | 6,185 |
| 22-24 | 4,552 |
| 25-29 | 2,219 |
| 35 and over | 1,433 |
| 30-34 | 1,081 |
| Under 18 | 0 |
Footnotes
*The racial-ethnic minorities count is calculated by taking the total number of students and subtracting white students, international students, and students whose race/ethnicity was unknown. This number is then divided by the total number of students at the school to obtain the racial-ethnic minorities percentage.
References
Department of Homeland Security Citizenship and Immigration Services
Find out how College Factual created their Diversity Rankings.