Kean total enrollment is approximately 14,064 students. 9,400 are undergraduates and 1,180 are graduate students.
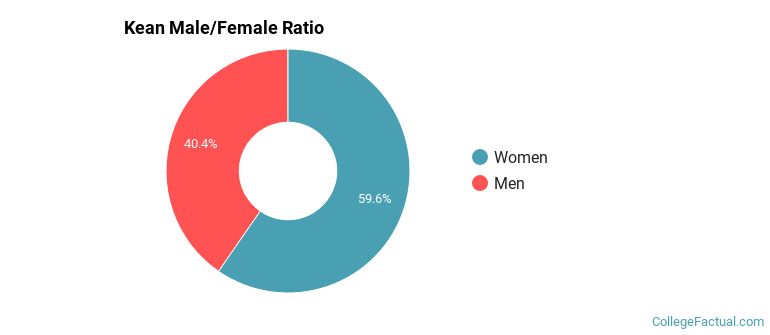
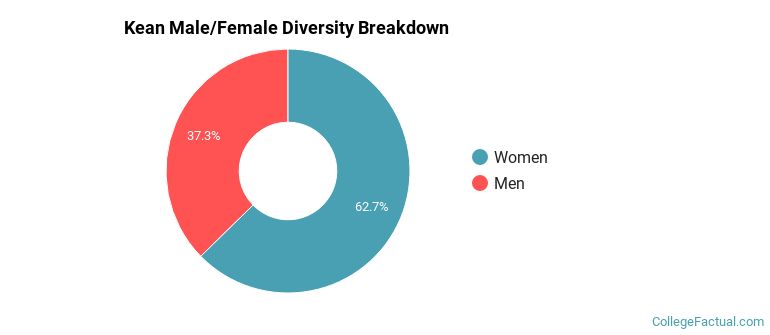
Male/Female Breakdown of Undergraduates
The full-time Kean undergraduate population is made up of 61% women, and 39% men.
For the gender breakdown for all students, go here.
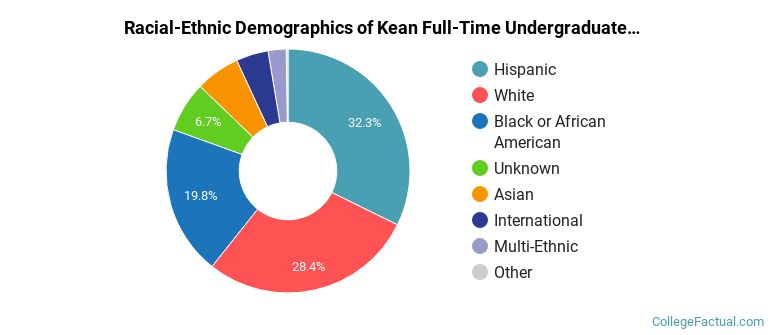
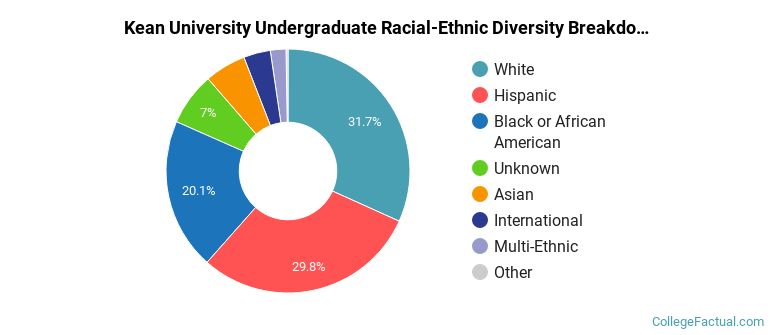
Kean Racial/Ethnic Breakdown of Undergraduates
| Race/Ethnicity | Number |
|---|---|
| Hispanic | 3,234 |
| White | 2,682 |
| Black or African American | 1,884 |
| Asian | 581 |
| Unknown | 536 |
| International | 233 |
| Multi-Ethnic | 219 |
| Native Hawaiian or Pacific Islander | 17 |
See racial/ethnic breakdown for all students.
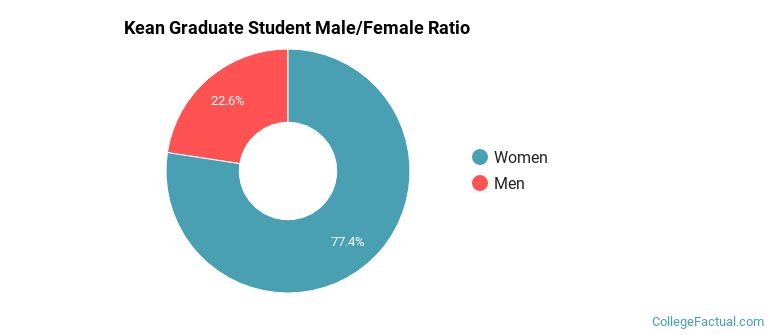
Male/Female Breakdown of Graduate Students
About 77% of full-time grad students are women, and 23% men.
For the gender breakdown for all students, go here.
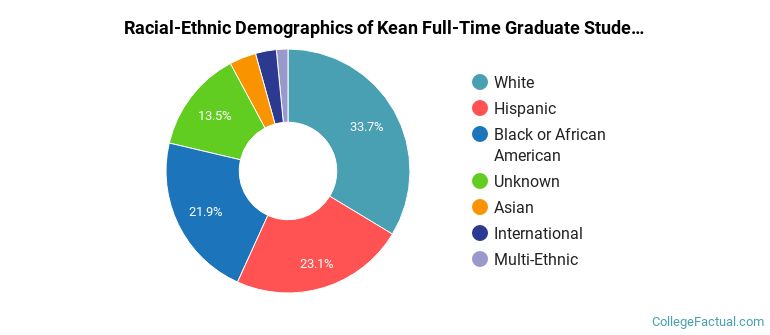
Kean Racial-Ethnic Breakdown of Graduate Students
| Race/Ethnicity | Number |
|---|---|
| White | 410 |
| Hispanic | 282 |
| Black or African American | 239 |
| Unknown | 139 |
| Asian | 58 |
| International | 28 |
| Multi-Ethnic | 20 |
| Native Hawaiian or Pacific Islander | 2 |
See racial/ethnic breakdown for all students.
| Race/Ethnicity | Number |
|---|---|
| White | 4,434 |
| Hispanic | 4,429 |
| Black or African American | 2,828 |
| Unknown | 921 |
| Asian | 807 |
| International | 311 |
| Multi-Ethnic | 291 |
| Native Hawaiian or Pacific Islander | 23 |
There are approximately 9,043 female students and 5,021 male students at Kean.
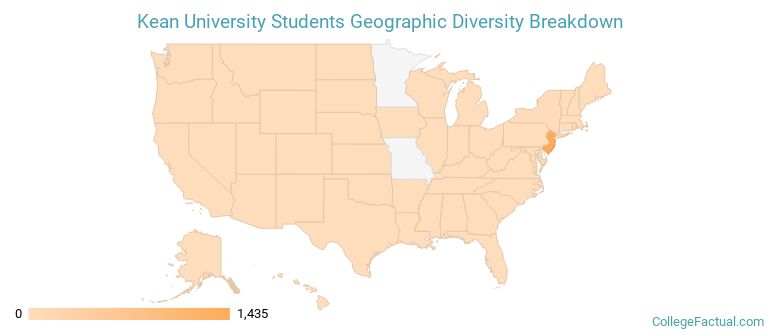
Kean ranks 1,794 out of 2,183 when it comes to geographic diversity.
4.46% of Kean students come from out of state, and 1.57% come from out of the country.
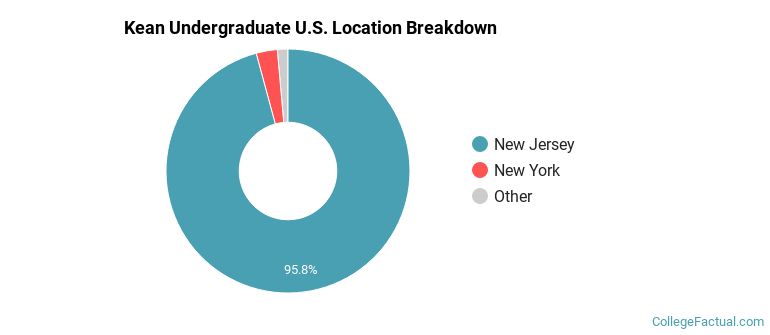
The undergraduate student body is split among 9 states (may include Washington D.C.). Click on the map for more detail.
| State | Amount |
|---|---|
| New Jersey | 1,435 |
| New York | 42 |
| Pennsylvania | 12 |
| California | 2 |
| Maryland | 2 |
Students from 55 countries are represented at this school, with the majority of the international students coming from China, India, and South Korea.
Learn more about international students at Kean.
A traditional college student is defined as being between the ages of 18-21. At Kean, 39.23% of students fall into that category, compared to the national average of 60%.
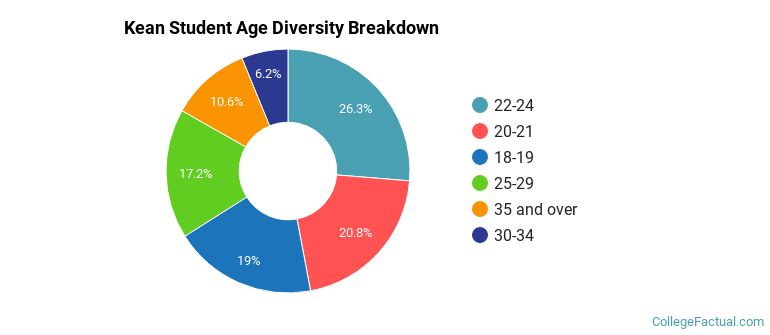
| Student Age Group | Amount |
|---|---|
| 22-24 | 3,693 |
| 20-21 | 2,916 |
| 18-19 | 2,665 |
| 25-29 | 2,419 |
| 35 and over | 1,490 |
| 30-34 | 867 |
| Under 18 | 0 |
Footnotes
*The racial-ethnic minorities count is calculated by taking the total number of students and subtracting white students, international students, and students whose race/ethnicity was unknown. This number is then divided by the total number of students at the school to obtain the racial-ethnic minorities percentage.
References
Department of Homeland Security Citizenship and Immigration Services
Image Credit: By Daniel Collins under License