
In its yearly rankings, College Factual analyzes over 2,000 colleges and universities to determine which ones are the best in a variety of categories, such as overall value, quality, diversity, which schools are the best for each major, and much more.
Kennebec Valley Community College was awarded 8 badges in the 2025 rankings. The highest ranked major at the school is allied health & medical assisting services.
Explore the best ranked schools for the programs you are most interested in.
Kennebec Valley Community College landed the #1,589 spot in College Factual's 2025 ranking of best overall colleges in the United States. The higher ed experts analyzed 2,152 colleges and universities across the nation to determine this ranking.
Kennebec Valley Community College also holds the #14 spot on the Best Colleges in Maine ranking.
See all of the rankings for Kennebec Valley Community College.
Kennebec Valley Community College has an open admissions policy, so you should not have much trouble being accepted by the school. Still, it is important to fill out the application completely and submit any requested materials, which may include proof that you have a high school diploma or the equivalent.
The student to faculty ratio at Kennebec Valley Community College is about average at 14 to 1. This ratio is often used to gauge how many students might be in an average class and how much time professors will have to spend with their students on an individual level. The national average for this metric is 15 to 1.
When estimating how much access students will have to their teachers, some people like to look at what percentage of faculty members are full time. This is because part-time teachers may not have as much time to spend on campus as their full-time counterparts.
The full-time faculty percentage at Kennebec Valley Community College is 100%. This is higher than the national average of 47%.
The freshmen retention rate is a sign of how many full-time students like a college or university well enough to come back for their sophomore year. At Kennebec Valley Community College this rate is 52%, which is a bit lower than the national average of 68%.
During the 2017-2018 academic year, there were 2,297 undergraduates at Kennebec Valley Community College with 515 being full-time and 1,782 being part-time.
| $0-30 K | $30K-48K | $48-75 | $75-110K | $110K + |
|---|---|---|---|---|
| $5,666 | $6,959 | $9,639 | $11,962 | $12,818 |
The net price is calculated by adding tuition, room, board and other costs and subtracting financial aid.Note that the net price is typically less than the published for a school. For more information on the sticker price of Kennebec Valley Community College, see our tuition and fees and room and board pages.
While almost two-thirds of students nationwide take out loans to pay for college, the percentage may be quite different for the school you plan on attending. At Kennebec Valley Community College, approximately 30% of students took out student loans averaging $5,644 a year. That adds up to $22,576 over four years for those students.
Get more details about paying for Kennebec Valley Community College.
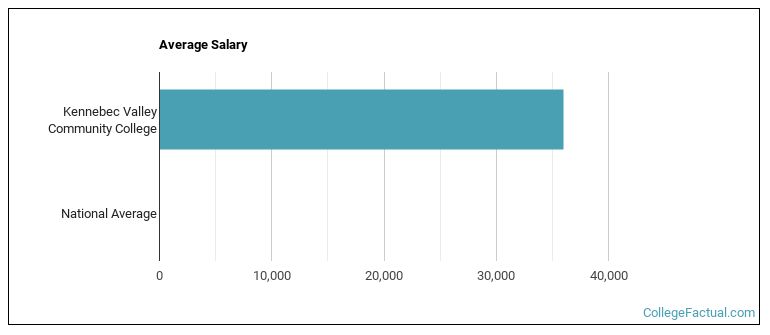
See which majors at Kennebec Valley Community College make the most money.
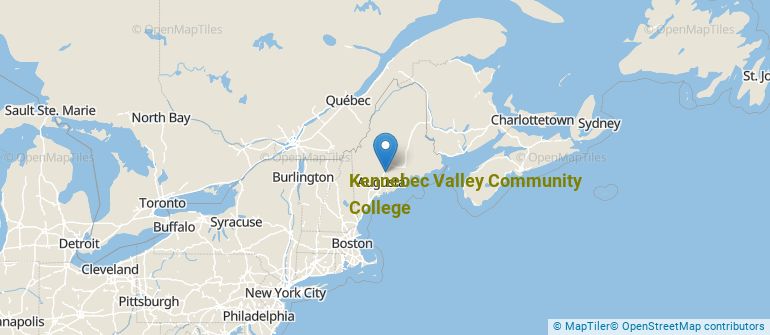
Get more details about the location of Kennebec Valley Community College.
Contact details for Kennebec Valley Community College are given below.
| Contact Details | |
|---|---|
| Address: | 92 Western Ave, Fairfield, ME 04937-1367 |
| Phone: | 207-453-5000 |
| Website: | www.kvcc.me.edu/ |
| Most Popular Majors | Bachelor’s Degrees | Average Salary of Graduates |
|---|---|---|
| Health Sciences & Services | 68 | NA |
| Liberal Arts General Studies | 48 | NA |
| Allied Health & Medical Assisting Services | 45 | NA |
| Electrical & Power Transmission Installers | 38 | NA |
| Allied Health Professions | 34 | NA |
| Nursing | 33 | NA |
| Teacher Education Grade Specific | 28 | NA |
| Mental & Social Health Services | 19 | NA |
| Precision Metal Working | 18 | NA |
| Clinical/Medical Laboratory Science | 10 | NA |
Online courses area a great option for busy, working students as well as for those who have scheduling conflicts and want to study on their own time. As time goes by, expect to see more and more online learning options become available.
In 2022-2023, 1,224 students took at least one online class at Kennebec Valley Community College. This is an increase from the 1,102 students who took online classes the previous year.
| Year | Took at Least One Online Class | Took All Classes Online |
|---|---|---|
| 2022-2023 | 1,224 | 815 |
| 2021-2022 | 1,102 | 762 |
| 2020-2021 | 1,446 | 993 |
| 2018-2019 | 988 | 428 |
Learn more about online learning at Kennebec Valley Community College.
Footnotes
*The racial-ethnic minorities count is calculated by taking the total number of students and subtracting white students, international students, and students whose race/ethnicity was unknown. This number is then divided by the total number of students at the school to obtain the racial-ethnic minorities percentage.
References
More about our data sources and methodologies.