Below are the key facts about this program at Kent State University at Kent. It is offered at the Bachelor’s, Certificate levels, with graduate study also available. It ranks as high as #7 out of 16 schools (Bachelor’s level) by College Factual. Jump to any of the following sections:
By College Factual’s measure, Kent State University at Kent as a strong choice for teacher education subject specific, placing at #319 out of 554 schools nationally.
| Ranking | Rank |
|---|---|
| Best Teacher Education Subject Specific Schools | 319 of 554 |
| Best Teacher Education Subject Specific Schools in Ohio | 8 of 20 |
| Best Teacher Education Subject Specific Schools in the Great Lakes Region | 54 of 100 |
The table below lists every degree level available for teacher education subject specific at Kent State University at Kent, along with how many graduates complete each level annually.
| Degree Level | Annual Graduates |
|---|---|
| Bachelor’s | 111 |
| Certificate | 2 |
| Master’s | 69 |
| Professional Certificate | 2 |
During the most recent reporting year, Kent State University at Kent awarded 111 bachelor’s degrees in teacher education subject specific.
Kent State University at Kent is in the top 15% of the country for teacher education subject specific at the bachelor’s level. Its best result was #7 out of 16 schools by College Factual.
Teacher Education Subject Specific majors who earn their bachelor’s degree from Kent State University at Kent earn a median of $48,715 a year. This is below $52,827, the median for all majors at Kent State University at Kent.
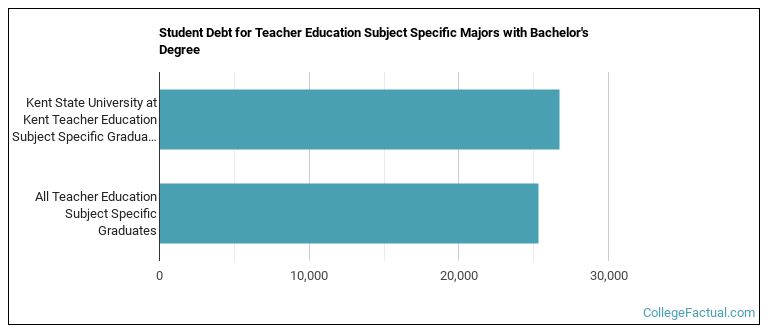
Earning a bachelor’s degree at Kent State University at Kent, teacher education subject specific students borrow a median amount of $26,750 in student loans. This is above $25,309, the typical median for all majors at Kent State University at Kent.
Average full-time tuition and fees are listed in the table below.
| In State | Out of State | |
|---|---|---|
| Tuition | $11,774 | $21,397 |
| Fees | $178 | $178 |
Read more about Kent State University at Kent tuition and fees.
In the most recent graduating class, 50% of teacher education subject specific bachelor’s degrees went to men and 50% went to women.
 The largest share of teacher education subject specific bachelor’s degree graduates at Kent State University at Kent were White. Approximately 87% of graduates fell into this category.
The following table and chart show the ethnic background for students who recently graduated from Kent State University at Kent with a bachelor’s in teacher education subject specific.

| Ethnic Background | Number of Students |
|---|---|
| Asian | 0 |
| Black or African American | 2 |
| Hispanic or Latino | 5 |
| White | 97 |
| Non-Resident Aliens | 2 |
| Other Races | 5 |
Kent State University at Kent granted 28 bachelor’s completions in social studies teacher education in the latest year of data — 32% to women and 68% to men. Most of these graduates identified as White (93%).
Kent State University at Kent granted 19 bachelor’s degrees in art teacher education recently — 95% to women and 5% to men. The largest share of these graduates were White (89%).
Kent State University at Kent granted 18 bachelor’s degrees in english/language arts teacher education in the latest year of data — 78% to women and 22% to men. Most of these graduates identified as White (94%).
Kent State University at Kent conferred 14 bachelor’s completions in physical education teaching and coaching in the latest year of data — 21% to women and 79% to men. Most of these graduates identified as White (71%).
Kent State University at Kent granted 12 bachelor’s degrees in mathematics teacher education in the most recent reporting year — 33% to women and 67% to men. Most of these graduates identified as White (83%).
Kent State University at Kent conferred 11 bachelor’s degrees in music teacher education recently — 45% to women and 55% to men. The most common background among these graduates was White (91%).
Kent State University at Kent awarded 7 bachelor’s completions in science teacher education/general science teacher education in the most recent reporting year — 43% to women and 57% to men. The largest share of these graduates were White (86%).
Kent State University at Kent conferred 2 bachelor’s degrees in health teacher education in the most recent reporting year — 0% to women and 100% to men. The most common background among these graduates was White (50%).
In the most recent year for which we have data, Kent State University at Kent conferred 2 certificate degrees in teacher education subject specific.
Kent State University at Kent is not currently ranked for teacher education subject specific at the certificate level.
In the most recent graduating class, 50% of teacher education subject specific certificate degrees went to men and 50% went to women.
 The majority of teacher education subject specific certificate degree graduates at Kent State University at Kent are White. Approximately 100% of graduates fell into this category.
The following table and chart show the ethnic background for students who recently graduated from Kent State University at Kent with a certificate in teacher education subject specific.

| Ethnic Background | Number of Students |
|---|---|
| Asian | 0 |
| Black or African American | 0 |
| Hispanic or Latino | 0 |
| White | 2 |
| Non-Resident Aliens | 0 |
| Other Races | 0 |
Kent State University at Kent granted 2 certificate completions in trade and industrial teacher education in the most recent reporting year — 50% to women and 50% to men. Most of these graduates identified as White (100%).
Graduate study is also available at Kent State University at Kent. Annual graduate completions by level are shown below.
| Graduate Level | Annual Graduates |
|---|---|
| Master’s Degrees in Teacher Education Subject Specific | 69 |
| Professional Certificate Degrees in Teacher Education Subject Specific | 2 |
