Explore the best ranked schools for the programs you are most interested in.
Kilgore College is ranked #1,868 out of 2,152 schools in the nation for overall quality on College Factual's 2025 Best Colleges list.
Kilgore College also holds the #99 spot on the Best Colleges in Texas ranking.
Returning adults and other non-traditional students may appreciate the fact that Kilgore College has an open admissions policy. This means that you'll only have to submit basic materials, which may include proof that you completed high school or an equivalent program.
With a student to faculty ratio of 18 to 1, Kilgore College is about average in this regard as the nationwide rate is 15 to 1. While this does not translate directly to class size, it's a good indicator of how much time professors will have to spend with their students on a one-on-one basis.
Another measure that is often used to estimate how much access students will have to their professors is how many faculty members are full-time. The idea here is that part-time faculty tend to spend less time on campus, so they may not be as available to students as full-timers.
The full-time faculty percentage at Kilgore College is 37%. This is lower than the national average of 47%.
The freshmen retention rate tells us what percentage of first-year, full-time students choose to continue on to their sophomore year at a particular school. The rate at Kilgore College is 67%, which is about average when compared to the national rate of 68%.
During the 2017-2018 academic year, there were 5,100 undergraduates at Kilgore College with 2,066 being full-time and 3,034 being part-time.
| $0-30 K | $30K-48K | $48-75 | $75-110K | $110K + |
|---|---|---|---|---|
| $5,862 | $6,178 | $8,366 | $11,104 | $11,121 |
The net price is calculated by adding tuition, room, board and other costs and subtracting financial aid.Note that the net price is typically less than the published for a school. For more information on the sticker price of Kilgore College, see our tuition and fees and room and board pages.
It's not uncommon for college students to take out loans to pay for school. In fact, almost 66% of students nationwide depend at least partially on loans. At Kilgore College, approximately 16% of students took out student loans averaging $5,504 a year. That adds up to $22,016 over four years for those students.
The student loan default rate at Kilgore College is 1.0%. This is significantly lower than the national default rate of 10.1%, which is a good sign that you'll be able to pay back your student loans.
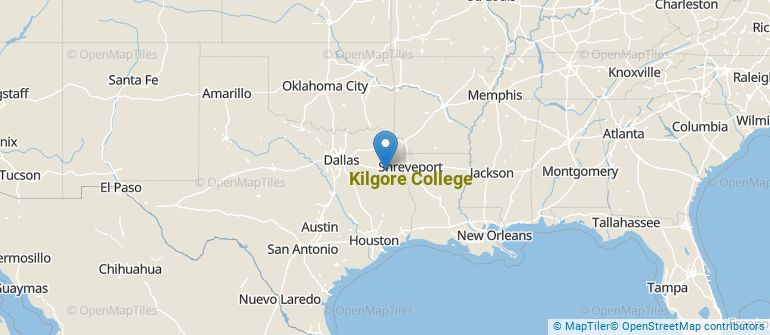
Get more details about the location of Kilgore College.
Contact details for Kilgore College are given below.
| Contact Details | |
|---|---|
| Address: | 1100 Broadway, Kilgore, TX 75662-3299 |
| Phone: | 903-984-8531 |
| Website: | https://www.kilgore.edu/ |
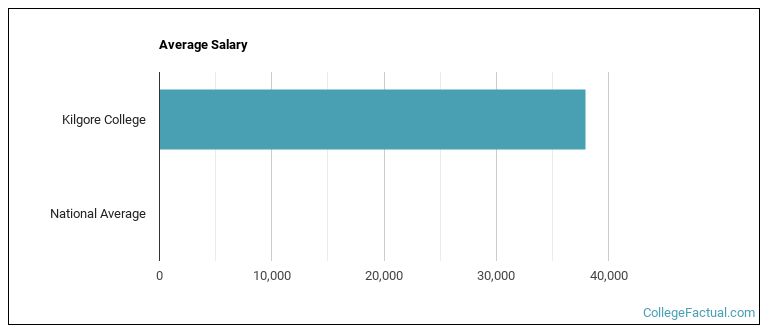
| Most Popular Majors | Bachelor’s Degrees | Average Salary of Graduates |
|---|---|---|
| Liberal Arts General Studies | 415 | NA |
| Cosmetology | 78 | NA |
| Nursing | 69 | NA |
| Practical Nursing & Nursing Assistants | 60 | NA |
| Physical Science Technicians | 42 | NA |
| Precision Metal Working | 40 | NA |
| Industrial Production Technology | 39 | NA |
| Vehicle Maintenance & Repair | 33 | NA |
| Electromechanical Engineering Technology | 31 | NA |
| Business Support & Assistant Services | 24 | NA |
Online learning is becoming popular at even the oldest colleges and universities in the United States. Not only are online classes great for returning adults with busy schedules, they are also frequented by a growing number of traditional students.
In 2022-2023, 2,513 students took at least one online class at Kilgore College. This is a decrease from the 2,530 students who took online classes the previous year.
| Year | Took at Least One Online Class | Took All Classes Online |
|---|---|---|
| 2022-2023 | 2,513 | 955 |
| 2021-2022 | 2,530 | 980 |
| 2020-2021 | 2,313 | 783 |
| 2018-2019 | 1,710 | 453 |
Footnotes
*The racial-ethnic minorities count is calculated by taking the total number of students and subtracting white students, international students, and students whose race/ethnicity was unknown. This number is then divided by the total number of students at the school to obtain the racial-ethnic minorities percentage.
References
More about our data sources and methodologies.
