Lake Forest total enrollment is approximately 1,583 students. 1,526 are undergraduates and 19 are graduate students.
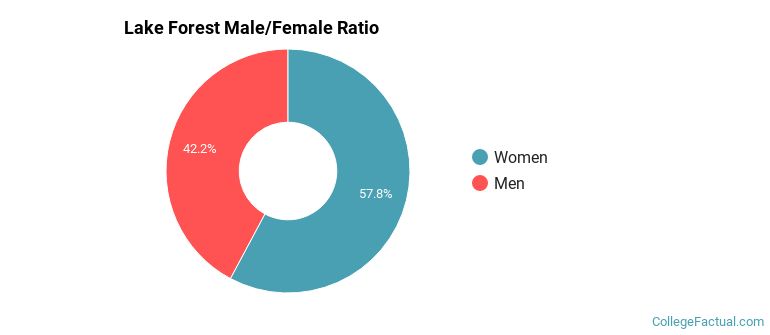
Male/Female Breakdown of Undergraduates
The full-time Lake Forest undergraduate population is made up of 59% women, and 41% men.
For the gender breakdown for all students, go here.
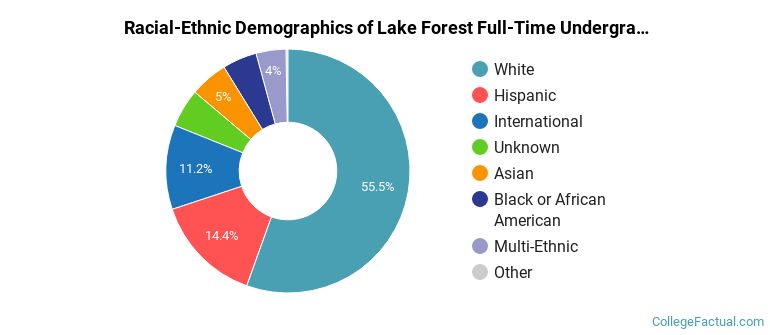
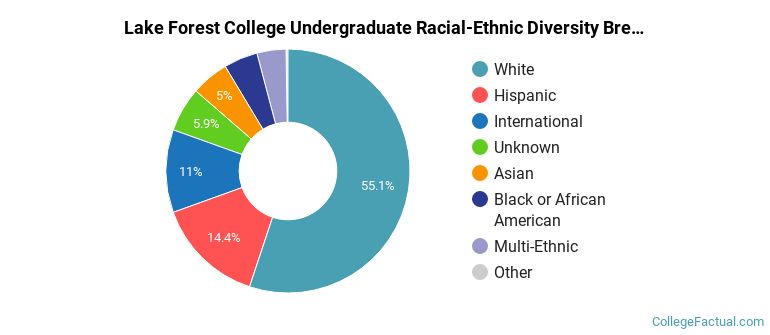
Lake Forest Racial/Ethnic Breakdown of Undergraduates
| Race/Ethnicity | Number |
|---|---|
| White | 752 |
| Hispanic | 270 |
| International | 207 |
| Unknown | 95 |
| Asian | 76 |
| Black or African American | 63 |
| Multi-Ethnic | 55 |
| Native Hawaiian or Pacific Islander | 2 |
See racial/ethnic breakdown for all students.
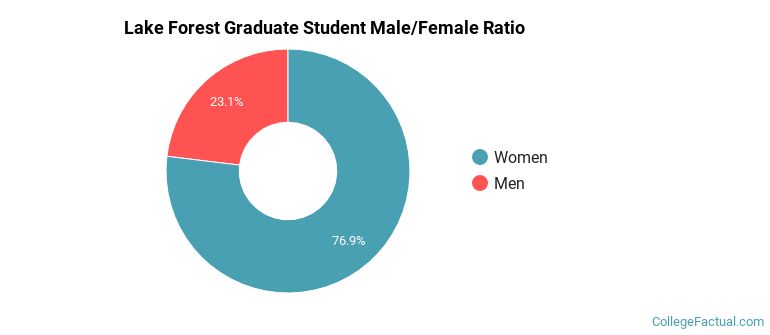
Male/Female Breakdown of Graduate Students
About 68% of full-time grad students are women, and 32% men.
For the gender breakdown for all students, go here.
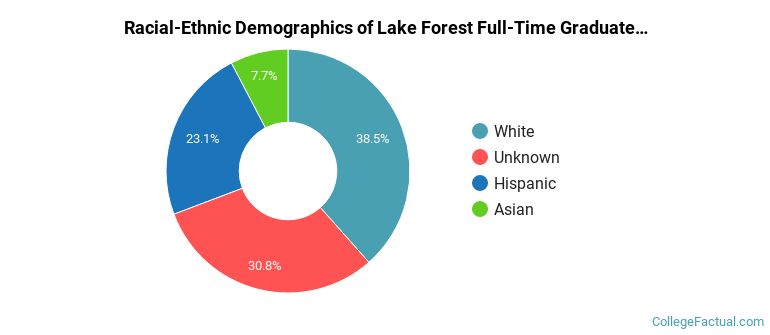
Lake Forest Racial-Ethnic Breakdown of Graduate Students
| Race/Ethnicity | Number |
|---|---|
| White | 14 |
| Asian | 2 |
| Unknown | 2 |
| Hispanic | 1 |
| Black or African American | 0 |
| Native Hawaiian or Pacific Islander | 0 |
| International | 0 |
| Multi-Ethnic | 0 |
See racial/ethnic breakdown for all students.
| Race/Ethnicity | Number |
|---|---|
| White | 787 |
| Hispanic | 277 |
| International | 209 |
| Unknown | 101 |
| Asian | 79 |
| Black or African American | 66 |
| Multi-Ethnic | 56 |
| Native Hawaiian or Pacific Islander | 2 |
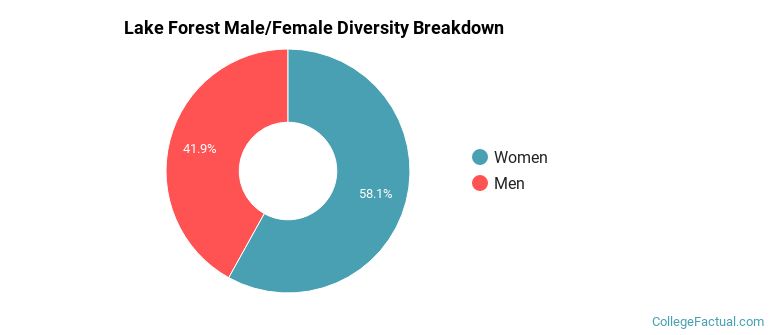
There are approximately 938 female students and 645 male students at Lake Forest.
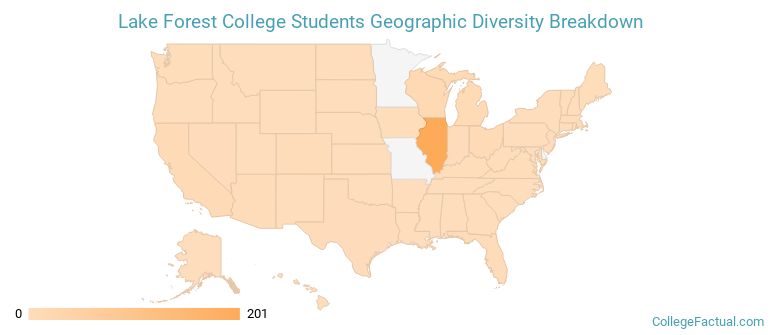
Lake Forest ranks 453 out of 2,183 when it comes to geographic diversity.
40.36% of Lake Forest students come from out of state, and 6.39% come from out of the country.
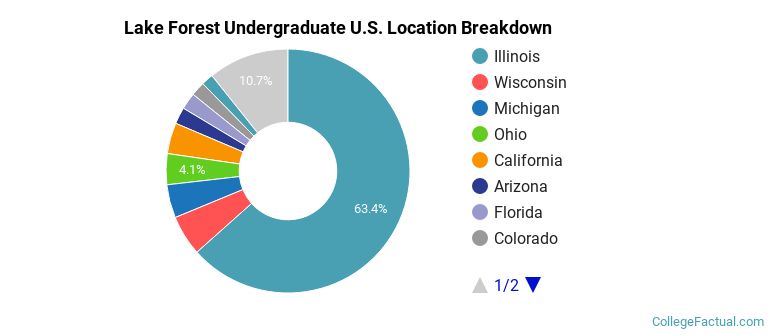
The undergraduate student body is split among 29 states (may include Washington D.C.). Click on the map for more detail.
| State | Amount |
|---|---|
| Illinois | 201 |
| Wisconsin | 17 |
| Michigan | 14 |
| California | 13 |
| Ohio | 13 |
Students from 65 countries are represented at this school, with the majority of the international students coming from China, Canada, and Swaziland.
Learn more about international students at Lake Forest.
A traditional college student is defined as being between the ages of 18-21. At Lake Forest, 81.91% of students fall into that category, compared to the national average of 60%.
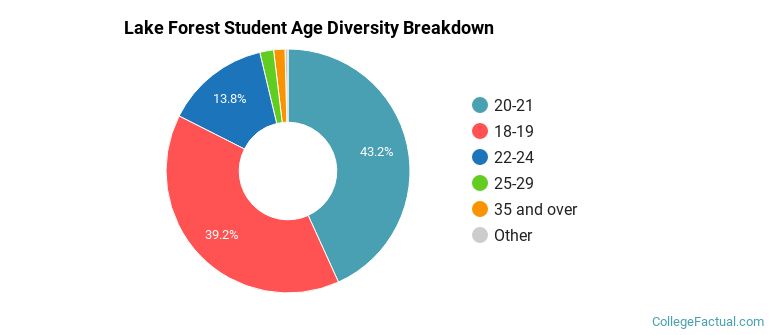
| Student Age Group | Amount |
|---|---|
| 20-21 | 662 |
| 18-19 | 601 |
| 22-24 | 212 |
| 25-29 | 28 |
| 35 and over | 23 |
| 30-34 | 6 |
| Under 18 | 0 |
Footnotes
*The racial-ethnic minorities count is calculated by taking the total number of students and subtracting white students, international students, and students whose race/ethnicity was unknown. This number is then divided by the total number of students at the school to obtain the racial-ethnic minorities percentage.
References
Department of Homeland Security Citizenship and Immigration Services
Image Credit: By Eudaimonia86 under License
Read College Factual's Diversity Ranking Methodology.