Explore the best ranked schools for the programs you are most interested in.
College Factual ranked LVC as #607 out of 2,152 colleges and universities in the country on its 2025 Best Colleges list. This is an improvement over the previous year, when LVC held the #621 spot on the Best Overall Colleges list.
LVC also holds the #35 spot on the Best Colleges in Pennsylvania ranking.
Lebanon Valley College has an acceptance rate of 77%, which makes it somewhat selective. Make sure it's not the only school you apply to, even if it's your school of choice. Whether you get in or not will largely depend on how you compare to other applicants.
About 42% of students accepted to LVC submitted their SAT scores. When looking at the 25th through the 75th percentile, SAT Evidence-Based Reading and Writing scores ranged between 560 and 640. Math scores were between 560 and 640.
At LVC, the student to faculty ratio is an excellent 11 to 1. That's much better than the national average of 15 to 1. This indicates that many classes will probably be small, and students will have ample opportunites to work closely with their professors and classmates.
In addition to the student to faculty ratio, some people look at what percentage of faculty members are full-time as a sign of how much time professors will be able to spend with their students. This is because part-time teachers may not be be on campus as much as their full-time counterparts.
The full-time faculty percentage at Lebanon Valley College is 47%. This is comparable to the national average of 47%.
Lebanon Valley College has a freshmen retention rate of 89%. That's a good sign that full-time students like the school and their professors enough to want to stick around for another year. It's also a sign that the admissions team did a good job in choosing applicants who were a good fit for the school.
Students are considered to have graduated on time if they finish their studies within four years. At LVC the on-time graduation rate of first-time, full-time students is 70%. That is great when compared to the national average of 33.3%
Find out more about the retention and graduation rates at Lebanon Valley College.
During the 2017-2018 academic year, there were 1,699 undergraduates at LVC with 1,621 being full-time and 78 being part-time.
| $0-30 K | $30K-48K | $48-75 | $75-110K | $110K + |
|---|---|---|---|---|
| $19,688 | $22,688 | $25,308 | $27,811 | $29,763 |
The net price is calculated by adding tuition, room, board and other costs and subtracting financial aid.Note that the net price is typically less than the published for a school. For more information on the sticker price of LVC, see our tuition and fees and room and board pages.
Almost 66% of college students who graduated with the class of 2018 took out student loans, but that percentage varies from school to school. At LVC, approximately 75% of students took out student loans averaging $9,755 a year. That adds up to $39,020 over four years for those students.
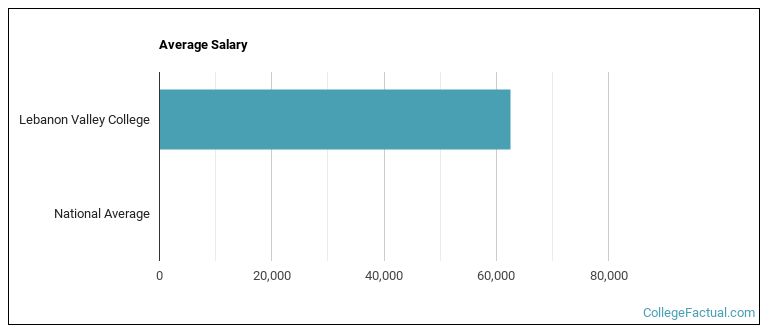
See which majors at Lebanon Valley College make the most money.
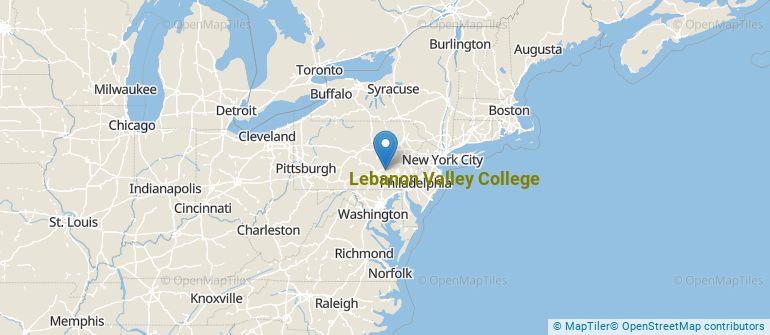
Get more details about the location of Lebanon Valley College.
Contact details for LVC are given below.
| Contact Details | |
|---|---|
| Address: | 101 N College Ave, Annville, PA 17003-1400 |
| Phone: | 717-867-6100 |
| Website: | www.lvc.edu/ |
| Most Popular Majors | Bachelor’s Degrees | Average Salary of Graduates |
|---|---|---|
| Health & Physical Education | 80 | $39,243 |
| Business Administration & Management | 70 | $44,334 |
| Teacher Education Grade Specific | 56 | $51,300 |
| Rehabilitation & Therapeutic Professions | 47 | NA |
| Communication Sciences | 44 | NA |
| Teacher Education Subject Specific | 28 | $49,263 |
| Music | 28 | $49,383 |
| General Biology | 24 | $33,783 |
| Special Education | 20 | $51,415 |
| Radio, Television & Digital Communication | 16 | $45,286 |
Online learning options are becoming more and more popular at American colleges and universities. Online classes are great for students who have busy schedules or for those who just want to study on their own time.
In 2022-2023, 427 students took at least one online class at Lebanon Valley College. This is a decrease from the 997 students who took online classes the previous year.
| Year | Took at Least One Online Class | Took All Classes Online |
|---|---|---|
| 2022-2023 | 427 | 157 |
| 2021-2022 | 997 | 99 |
| 2020-2021 | 1,649 | 93 |
| 2018-2019 | 192 | 38 |
Footnotes
*The racial-ethnic minorities count is calculated by taking the total number of students and subtracting white students, international students, and students whose race/ethnicity was unknown. This number is then divided by the total number of students at the school to obtain the racial-ethnic minorities percentage.
References
More about our data sources and methodologies.