Biochemistry, Biophysics & Molecular Biology is a major offered under the biological and biomedical sciences program of study at Lehigh University. Here, you’ll find out more about the major bachelor’s degree program in biochemistry, including such details as the number of graduates, ethnicity of students, related majors and concentrations, and more.
You can jump to any section of this page using the links below:
In order to help students and their parents find the best school for them, we have created several different types of college rankings, which are updated yearly. In College Factual's most recent rankings for the best schools for biochemistry majors, Lehigh came in at #14. This puts it in the top 5% of the country in this field of study. It is also ranked #2 in Pennsylvania.
Here are some of the other rankings for Lehigh.
In 2019-2020, the average part-time undergraduate tuition at Lehigh was $2,285 per credit hour for both in-state and out-of-state students. Information about average full-time undergraduate tuition and fees is shown in the table below.
| In State | Out of State | |
|---|---|---|
| Tuition | $54,790 | $54,790 |
| Fees | $470 | $470 |
| Books and Supplies | $1,000 | $1,000 |
| On Campus Room and Board | $14,740 | $14,740 |
| On Campus Other Expenses | $1,065 | $1,065 |
Learn more about Lehigh tuition and fees.
Online degrees for the Lehigh biochemistry bachelor’s degree program are not available at this time. To see if the school offers distance learning options in other areas, visit the Lehigh Online Learning page.
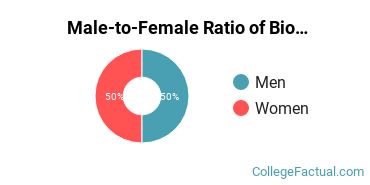
Of the students who received their bachelor’s degree in biochemistry in 2019-2020, 56.3% of them were women. This is about the same as the countrywide number of 54.9%.
Racial-ethnic minority graduates* made up 31.3% of the biochemistry bachelor’s degrees at Lehigh in 2019-2020. This is lower than the nationwide number of 40%.
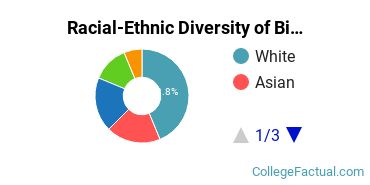
| Race/Ethnicity | Number of Students |
|---|---|
| Asian | 0 |
| Black or African American | 2 |
| Hispanic or Latino | 3 |
| Native American or Alaska Native | 0 |
| Native Hawaiian or Pacific Islander | 0 |
| White | 10 |
| International Students | 1 |
| Other Races/Ethnicities | 0 |
Biochemistry, Biophysics & Molecular Biology students may decide to major in one of the following focus areas.
| Focus Area | Annual Graduates |
|---|---|
| Biochemistry | 9 |
| Molecular Biology | 7 |
You may also be interested in one of these majors related to biochemistry, biophysics and molecular biology.
| Related Major | Annual Graduates |
|---|---|
| General Biology | 46 |
| Neurobiology & Neurosciences | 28 |
View All Biochemistry, Biophysics & Molecular Biology Related Majors >
*The racial-ethnic minorities count is calculated by taking the total number of students and subtracting white students, international students, and students whose race/ethnicity was unknown. This number is then divided by the total number of students at the school to obtain the racial-ethnic minorities percentage.
More about our data sources and methodologies.