College Factual  by our College Data Analytics Team
       Unbiased Factual Guarantee

Liberty Technical College Demographics & Diversity Report

Below Average Overall Diversity
Below Average Racial-Ethnic Diversity
Below Average Male/Female Diversity
Who is the typical student at Liberty Technical College? College Factual wanted to know the truth so we ran the numbers. We analyzed racial diversity, gender ratios, age and location diversity of college campuses accross the U.S. The results of the Liberty Technical College <nil> diversity report are below.

Racial/Ethnic Diversity

High Student Age Diversity

High Student Age Diversity
46.67% Traditional College Age
The age diversity score this school received indicates it is doing a good job attracting students of all ages.

Student Age Diversity  81.91 out of 100.
Less Diverse
More Diverse

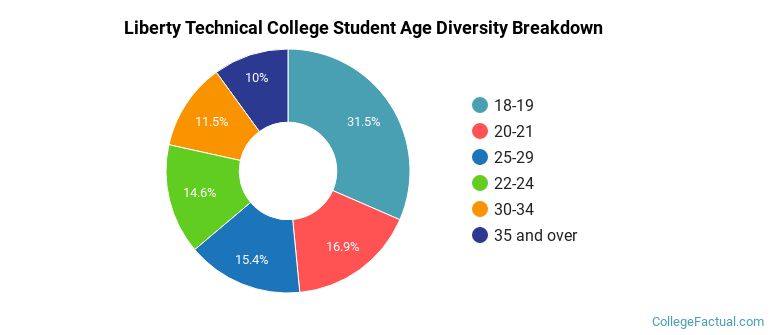
A traditional college student is defined as being between the ages of 18-21. At Liberty Technical College, 46.67% of students fall into that category, compared to the national average of 60%.

undefined
Student Age Group Amount
18-19 41
20-21 22
25-29 20
22-24 19
30-34 15
35 and over 13
Under 18 0

Notes and References

Footnotes

*The racial-ethnic minorities count is calculated by taking the total number of students and subtracting white students, international students, and students whose race/ethnicity was unknown. This number is then divided by the total number of students at the school to obtain the racial-ethnic minorities percentage.

References

Popular Reports

College Rankings
Best by Location
Degree Guides by Major
Graduate Programs

Compare Your School Options