Life total enrollment is approximately 2,761 students. 753 are undergraduates and 1,645 are graduate students.
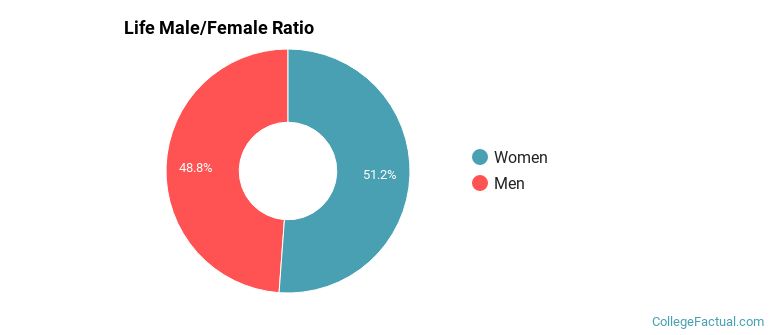
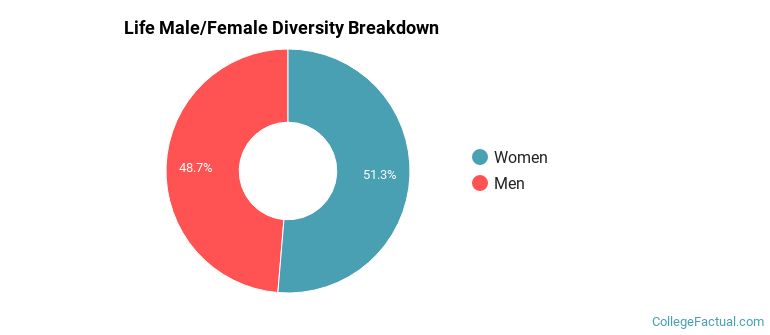
Male/Female Breakdown of Undergraduates
The full-time Life undergraduate population is made up of 50% women, and 50% men.
For the gender breakdown for all students, go here.
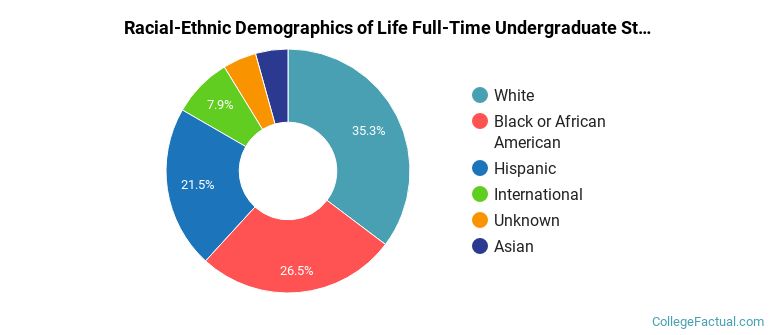
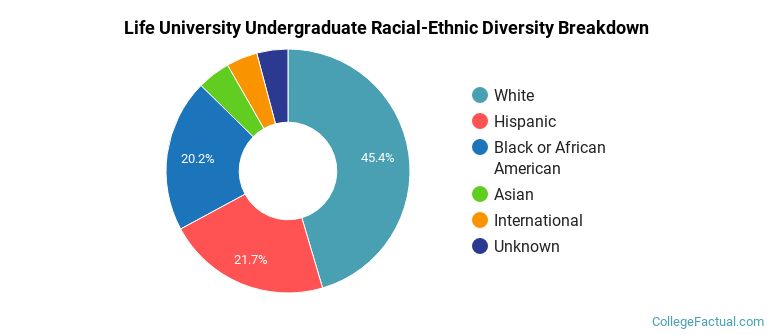
Life Racial/Ethnic Breakdown of Undergraduates
| Race/Ethnicity | Number |
|---|---|
| White | 303 |
| Black or African American | 205 |
| International | 92 |
| Unknown | 89 |
| Asian | 28 |
| Hispanic | 22 |
| Native Hawaiian or Pacific Islander | 0 |
| Multi-Ethnic | 0 |
See racial/ethnic breakdown for all students.
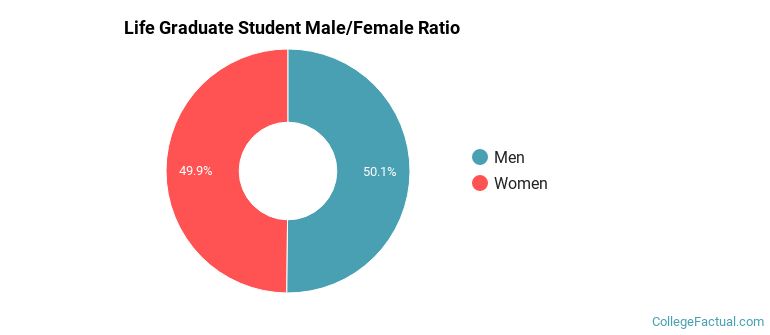
Male/Female Breakdown of Graduate Students
About 51% of full-time grad students are women, and 49% men.
For the gender breakdown for all students, go here.
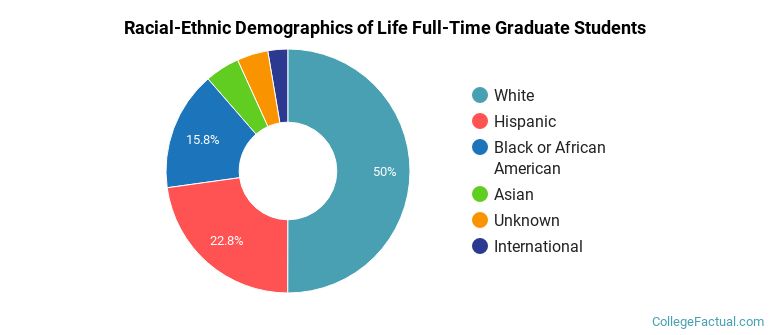
Life Racial-Ethnic Breakdown of Graduate Students
| Race/Ethnicity | Number |
|---|---|
| White | 809 |
| Hispanic | 358 |
| Black or African American | 288 |
| Unknown | 66 |
| Asian | 53 |
| International | 53 |
| Native Hawaiian or Pacific Islander | 0 |
| Multi-Ethnic | 0 |
See racial/ethnic breakdown for all students.
| Race/Ethnicity | Number |
|---|---|
| White | 1,276 |
| Black or African American | 581 |
| Hispanic | 429 |
| Unknown | 188 |
| International | 158 |
| Asian | 93 |
| Multi-Ethnic | 3 |
| Native Hawaiian or Pacific Islander | 0 |
There are approximately 1,437 female students and 1,324 male students at Life.
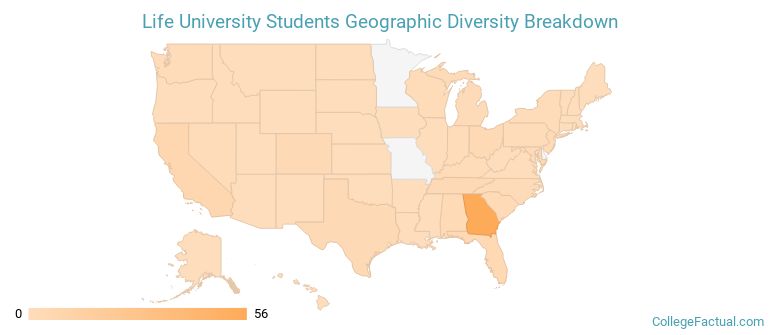
Life ranks 536 out of 2,183 when it comes to geographic diversity.
47.66% of Life students come from out of state, and 7.03% come from out of the country.
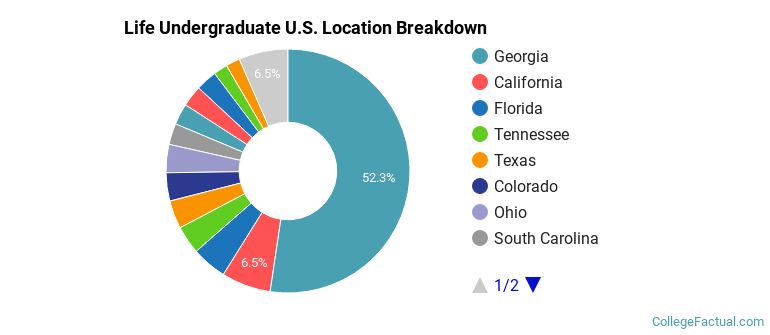
The undergraduate student body is split among 20 states (may include Washington D.C.). Click on the map for more detail.
| State | Amount |
|---|---|
| Georgia | 56 |
| California | 7 |
| Florida | 5 |
| Colorado | 4 |
| Ohio | 4 |
Students from 52 countries are represented at this school, with the majority of the international students coming from Japan, China, and Canada.
Learn more about international students at Life.
A traditional college student is defined as being between the ages of 18-21. At Life, 16.84% of students fall into that category, compared to the national average of 60%.
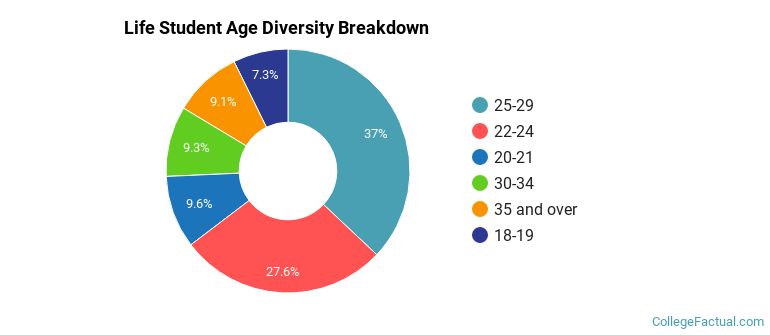
| Student Age Group | Amount |
|---|---|
| 25-29 | 965 |
| 22-24 | 720 |
| 20-21 | 251 |
| 30-34 | 243 |
| 35 and over | 237 |
| 18-19 | 190 |
| Under 18 | 0 |
Footnotes
*The racial-ethnic minorities count is calculated by taking the total number of students and subtracting white students, international students, and students whose race/ethnicity was unknown. This number is then divided by the total number of students at the school to obtain the racial-ethnic minorities percentage.
References
Department of Homeland Security Citizenship and Immigration Services
Read College Factual's Diversity Ranking Methodology.