LU California total enrollment is approximately 371 students. 79 are undergraduates and 278 are graduate students.
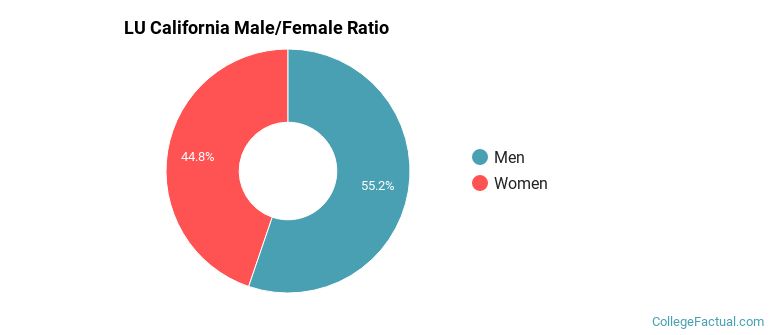
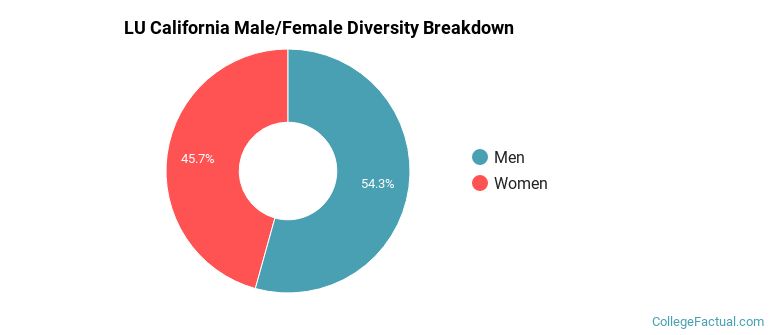
Male/Female Breakdown of Undergraduates
The full-time LU California undergraduate population is made up of 48% women, and 52% men.
For the gender breakdown for all students, go here.
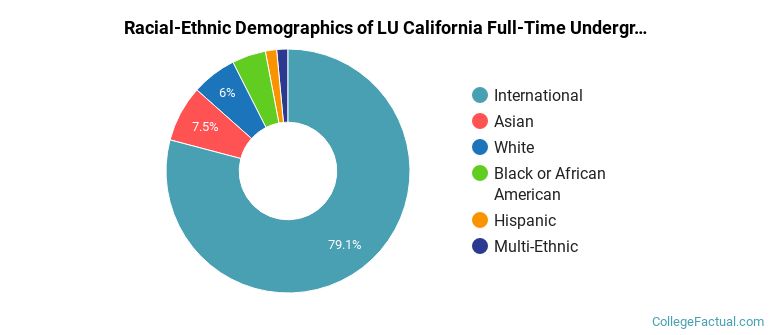
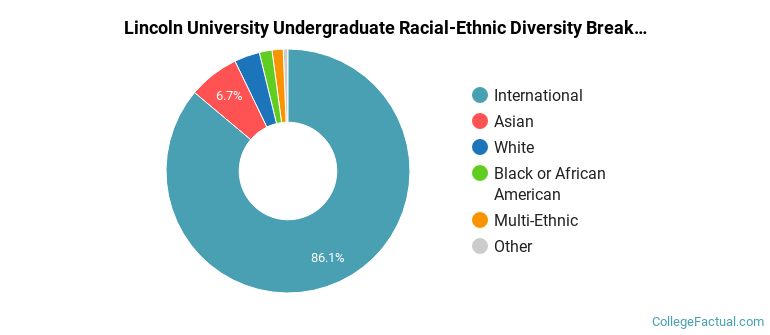
LU California Racial/Ethnic Breakdown of Undergraduates
| Race/Ethnicity | Number |
|---|---|
| International | 49 |
| White | 10 |
| Asian | 9 |
| Black or African American | 6 |
| Hispanic | 4 |
| Multi-Ethnic | 1 |
| Native Hawaiian or Pacific Islander | 0 |
| Unknown | 0 |
See racial/ethnic breakdown for all students.
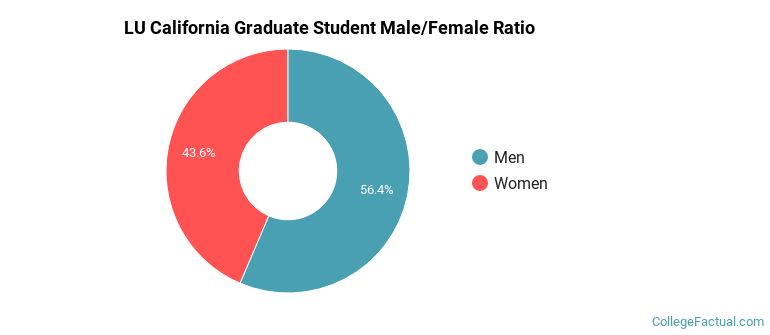
Male/Female Breakdown of Graduate Students
About 48% of full-time grad students are women, and 52% men.
For the gender breakdown for all students, go here.
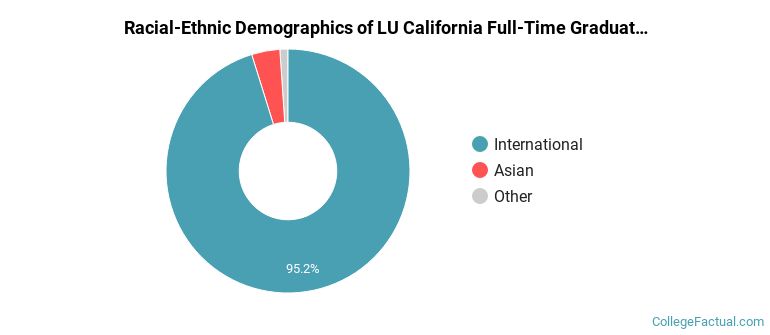
LU California Racial-Ethnic Breakdown of Graduate Students
| Race/Ethnicity | Number |
|---|---|
| International | 275 |
| Asian | 3 |
| Black or African American | 0 |
| Hispanic | 0 |
| White | 0 |
| Native Hawaiian or Pacific Islander | 0 |
| Multi-Ethnic | 0 |
| Unknown | 0 |
See racial/ethnic breakdown for all students.
| Race/Ethnicity | Number |
|---|---|
| International | 324 |
| Asian | 22 |
| White | 12 |
| Black or African American | 8 |
| Hispanic | 4 |
| Multi-Ethnic | 1 |
| Native Hawaiian or Pacific Islander | 0 |
| Unknown | 0 |
There are approximately 178 female students and 193 male students at LU California.
LU California ranks 1,956 out of 2,183 when it comes to geographic diversity.
0% of LU California students come from out of state, and 75% come from out of the country.
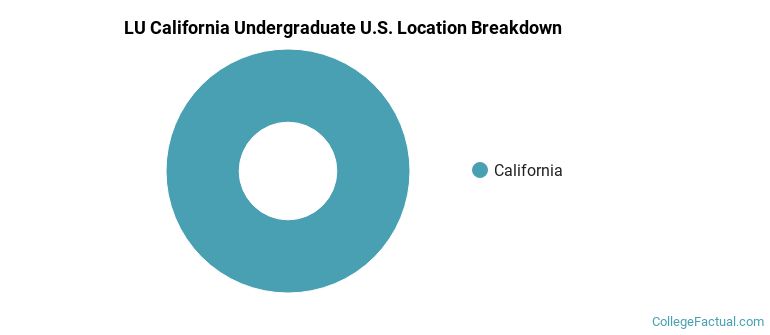
The undergraduate student body is split among 1 states (may include Washington D.C.). Click on the map for more detail.
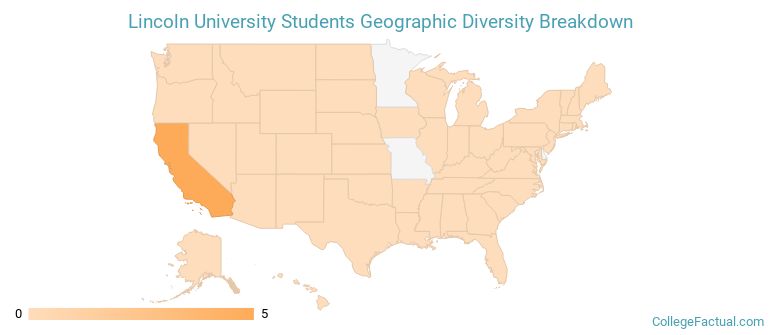
| State | Amount |
|---|---|
| California | 5 |
| Alaska | 0 |
| Alabama | 0 |
| Arkansas | 0 |
| Arizona | 0 |
Students from 59 countries are represented at this school, with the majority of the international students coming from Nepal, India, and Thailand.
Learn more about international students at LU California.
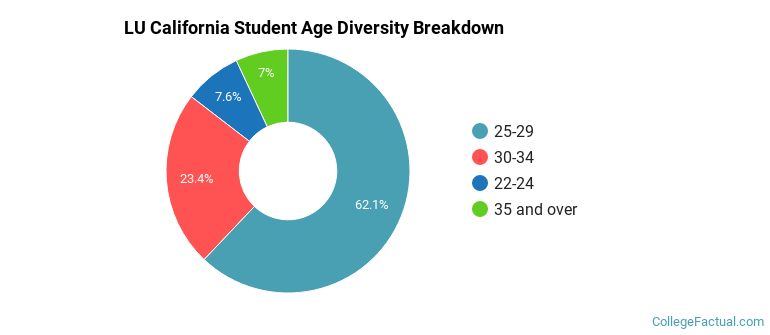
| Student Age Group | Amount |
|---|---|
| 25-29 | 409 |
| 30-34 | 154 |
| 22-24 | 50 |
| 35 and over | 46 |
| 18-19 | 0 |
| 20-21 | 0 |
| Under 18 | 0 |
Footnotes
*The racial-ethnic minorities count is calculated by taking the total number of students and subtracting white students, international students, and students whose race/ethnicity was unknown. This number is then divided by the total number of students at the school to obtain the racial-ethnic minorities percentage.
References
Department of Homeland Security Citizenship and Immigration Services
Image Credit: By Chris Goddard under License