Explore the best ranked schools for the programs you are most interested in.
According to College Factual's 2025 analysis, LU Missouri is ranked #2,028 out of 2,152 schools in the nation that were analyzed for overall quality.
LU Missouri also holds the #45 spot on the Best Colleges in Missouri ranking.
Since Lincoln University has an open admissions policy, being accepted to the school isn't that hard. However, a full basic things - such as a high school diploma or equivalent - may be required. Also, go over your application to make sure it is complete before you submit it.
The student to faculty ratio at Lincoln University is about average at 15 to 1. This ratio is often used to gauge how many students might be in an average class and how much time professors will have to spend with their students on an individual level. The national average for this metric is 15 to 1.
In addition to the student to faculty ratio, some people look at what percentage of faculty members are full-time as a sign of how much time professors will be able to spend with their students. This is because part-time teachers may not be be on campus as much as their full-time counterparts.
The full-time faculty percentage at Lincoln University is 71%. This is higher than the national average of 47%.
The freshmen retention rate of 49% tells us that most first-year, full-time students don't stick around for a second year at Lincoln University. Students may have a variety of reasons for this, such as only intending to attend a school for one year while they brush up on certain subjects.
The on-time graduation rate is the percent of first-time, full time students who obtain their bachelor's degree in four years or less. This rate is 12% for first-time, full-time students at LU Missouri, which is lower than the national rate of 33.3%.
Find out more about the retention and graduation rates at Lincoln University.
During the 2017-2018 academic year, there were 1,892 undergraduates at LU Missouri with 1,312 being full-time and 580 being part-time.
| $0-30 K | $30K-48K | $48-75 | $75-110K | $110K + |
|---|---|---|---|---|
| $8,225 | $8,357 | $11,013 | $12,230 | $12,447 |
The net price is calculated by adding tuition, room, board and other costs and subtracting financial aid.Note that the net price is typically less than the published for a school. For more information on the sticker price of LU Missouri, see our tuition and fees and room and board pages.
Almost 66% of college students who graduated with the class of 2018 took out student loans, but that percentage varies from school to school. At LU Missouri, approximately 45% of students took out student loans averaging $5,417 a year. That adds up to $21,668 over four years for those students.
The student loan default rate at LU Missouri is 1.0%. This is significantly lower than the national default rate of 10.1%, which is a good sign that you'll be able to pay back your student loans.
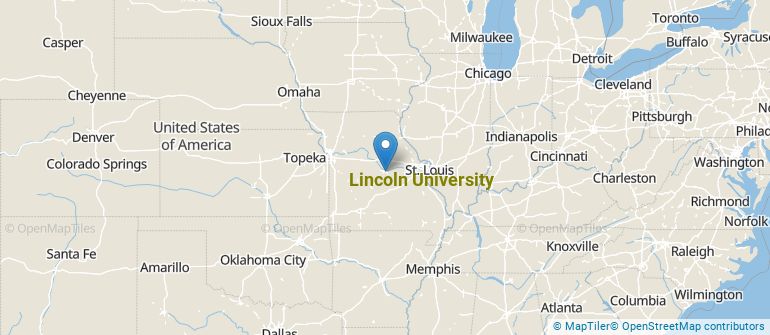
Get more details about the location of Lincoln University.
Contact details for LU Missouri are given below.
| Contact Details | |
|---|---|
| Address: | 820 Chestnut Street, Jefferson City, MO 65101 |
| Phone: | 573-681-5000 |
| Website: | https://www.lincolnu.edu/ |
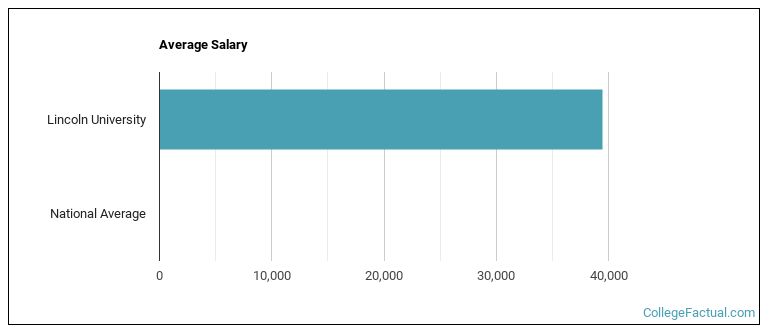
| Most Popular Majors | Bachelor’s Degrees | Average Salary of Graduates |
|---|---|---|
| Nursing | 59 | $66,592 |
| Business Administration & Management | 47 | $39,331 |
| Food, Nutrition & Related Services | 23 | NA |
| Liberal Arts General Studies | 20 | $21,282 |
| General Psychology | 17 | NA |
| General Agriculture | 16 | NA |
| Criminal Justice & Corrections | 15 | $32,331 |
| Social Work | 13 | $32,951 |
| Other Social Sciences | 12 | NA |
| Teacher Education Grade Specific | 11 | $33,262 |
Online learning options are becoming more and more popular at American colleges and universities. Online classes are great for students who have busy schedules or for those who just want to study on their own time.
In 2022-2023, 869 students took at least one online class at Lincoln University. This is a decrease from the 872 students who took online classes the previous year.
| Year | Took at Least One Online Class | Took All Classes Online |
|---|---|---|
| 2022-2023 | 869 | 146 |
| 2021-2022 | 872 | 164 |
| 2020-2021 | 904 | 117 |
| 2018-2019 | 866 | 111 |
If you’re considering Lincoln University, here are some more schools you may be interested in knowing more about.
Curious on how these schools stack up against LU Missouri? Pit them head to head with College Combat, our free interactive tool that lets you compare college on the features that matter most to you!
Footnotes
*The racial-ethnic minorities count is calculated by taking the total number of students and subtracting white students, international students, and students whose race/ethnicity was unknown. This number is then divided by the total number of students at the school to obtain the racial-ethnic minorities percentage.
References
More about our data sources and methodologies.