We've pulled together some essential information you should know about the program, including how many students graduate each year, the ethnic diversity of these students, average starting salaries, and more. Also, learn how Lindenwood University ranks among other schools offering degrees in general business.
Go directly to any of the following sections:
The bachelor's program at Lindenwood University was ranked #69 on College Factual's Best Schools for general business list. It is also ranked #5 in Missouri.
During the 2021-2022 academic year, Lindenwood University handed out 188 bachelor's degrees in general business/commerce. This is a decrease of 6% over the previous year when 200 degrees were handed out.
In 2022, 33 students received their master’s degree in general business from Lindenwood University. This makes it the #60 most popular school for general business master’s degree candidates in the country.
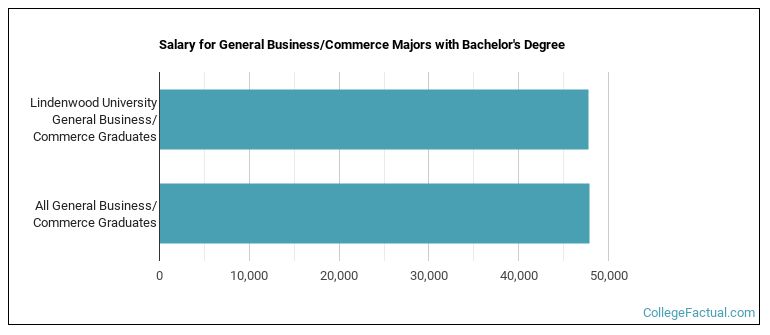
The median salary of general business students who receive their bachelor's degree at Lindenwood University is $47,821. Unfortunately, this is lower than the national average of $47,842 for all general business students.
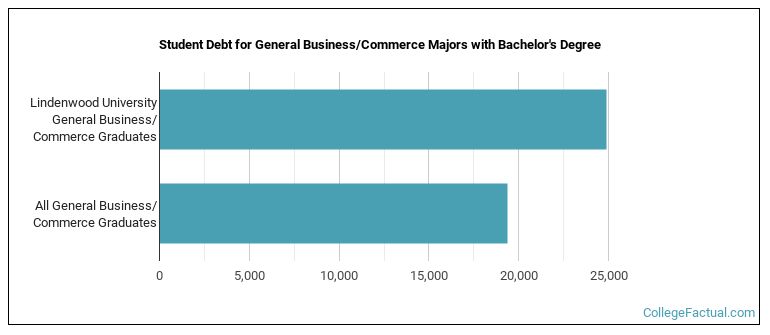
While getting their bachelor's degree at Lindenwood University, general business students borrow a median amount of $24,915 in student loans. This is higher than the the typical median of $19,374 for all general business majors across the country.
The typical student loan payment of a bachelor's degree student from the general business program at Lindenwood University is $223 per month.
In 2022-2023, the average part-time undergraduate tuition at Lindenwood University was $537 per credit hour for both in-state and out-of-state students. The average full-time tuition and fees for undergraduates are shown in the table below.
| In State | Out of State | |
|---|---|---|
| Tuition | $19,900 | $19,900 |
| Fees | $1,200 | $1,200 |
| Books and Supplies | $1,400 | $1,400 |
| On Campus Room and Board | $10,800 | $10,800 |
| On Campus Other Expenses | $2,900 | $2,900 |
Learn more about Lindenwood University tuition and fees.
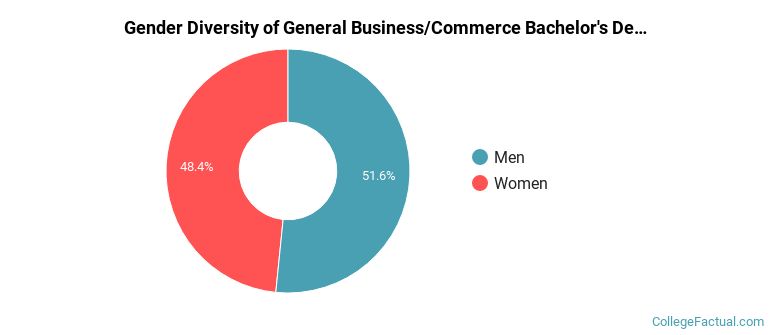
In the 2021-2022 academic year, 188 students earned a bachelor's degree in general business from Lindenwood University. About 48% of these graduates were women and the other 52% were men.
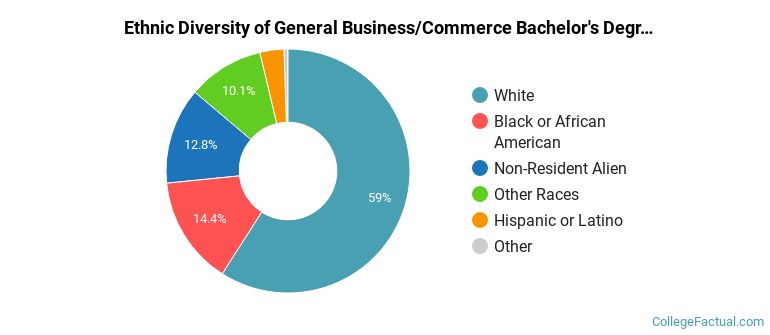
The majority of the students with this major are white. About 59% of 2022 graduates were in this category.
The following table and chart show the ethnic background for students who recently graduated from Lindenwood University with a bachelor's in general business.
| Ethnic Background | Number of Students |
|---|---|
| Asian | 1 |
| Black or African American | 27 |
| Hispanic or Latino | 6 |
| White | 111 |
| Non-Resident Aliens | 24 |
| Other Races | 19 |
Lindenwood University does not offer an online option for its general business bachelor’s degree program at this time. To see if the school offers distance learning options in other areas, visit the Lindenwood University Online Learning page.
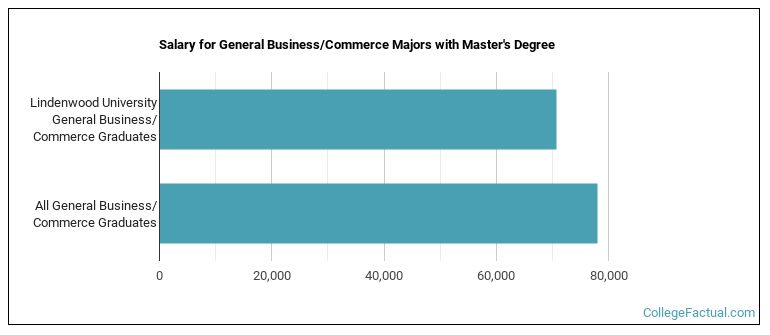
Graduates of the master's general business program at Lindenwood University make a median salary of $70,744. This is less than what their typical peers from other schools make. Their median salary is $78,070.
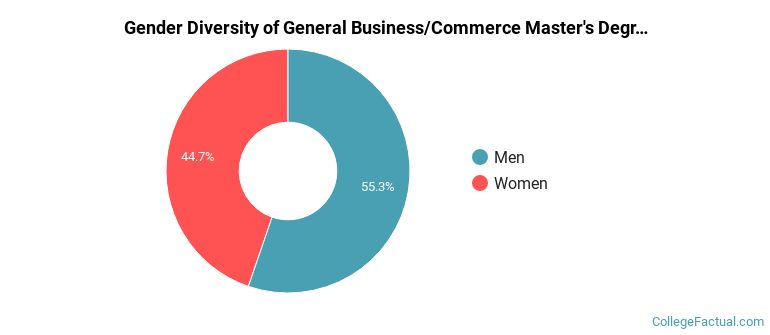
During the 2021-2022 academic year, 38 students graduated with a master's degree in general business from Lindenwood University. About 55% were men and 45% were women.
The majority of master's degree recipients in this major at Lindenwood University are white. In the most recent graduating class for which data is available, 66% of students fell into this category.
The following table and chart show the ethnic background for students who recently graduated from Lindenwood University with a master's in general business.
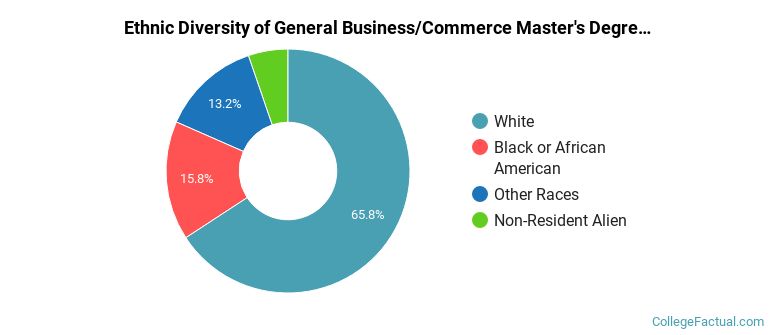
| Ethnic Background | Number of Students |
|---|---|
| Asian | 0 |
| Black or African American | 6 |
| Hispanic or Latino | 0 |
| White | 25 |
| Non-Resident Aliens | 2 |
| Other Races | 5 |
Take a look at the following statistics related to the make-up of the general business majors at Lindenwood University.
| Related Major | Annual Graduates |
|---|---|
| Business Administration & Management | 78 |
| Accounting | 57 |
| Marketing | 57 |
| Finance & Financial Management | 56 |
| Human Resource Management | 44 |
More about our data sources and methodologies.