We’ve pulled together the essential facts you should know about the program at Long Island University. It is offered at the Bachelor’s level, with graduate study also available. It ranks as high as #2 out of 4 schools (Bachelor’s level) by College Factual. Jump to any of the following sections:
College Factual rates Long Island University as a strong choice for pharmacy/pharmaceutical sciences, placing at #47 out of 60 schools nationally.
The table below lists every degree level offered in pharmacy/pharmaceutical sciences at Long Island University, along with how many graduates complete each level annually.
| Degree Level | Annual Graduates |
|---|---|
| Bachelor’s | 139 |
| Master’s | 94 |
| Doctoral | 5 |
During the most recent reporting year, Long Island University conferred 139 bachelor’s degrees in pharmacy/pharmaceutical sciences.
Long Island University is among the very best schools in the country for pharmacy/pharmaceutical sciences at the bachelor’s level. Specifically, it ranked #2 out of 4 schools by College Factual.
Pharmacy/Pharmaceutical Sciences majors who earn their bachelor’s degree from Long Island University earn a median of $125,308 a year. This is above $88,659, the median for all majors at Long Island University.
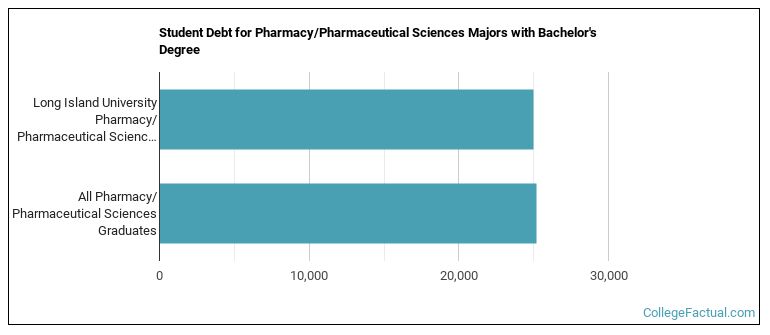
To complete a bachelor’s at Long Island University, pharmacy/pharmaceutical sciences students borrow a median amount of $25,000 in student loans. This is below $25,211, the typical median for all majors at Long Island University.
The full-time undergraduate tuition and fees are shown below.
| In State | Out of State | |
|---|---|---|
| Tuition | $37,926 | $40,248 |
| Fees | $2,184 | $2,184 |
Read more about Long Island University tuition and fees.
Among recent graduates, 28% of pharmacy/pharmaceutical sciences bachelor’s degrees went to men and 72% went to women.
 The largest share of pharmacy/pharmaceutical sciences bachelor’s degree graduates at Long Island University were Asian. Roughly 35% of graduates fell into this category.
The following table and chart show the ethnic background for students who recently graduated from Long Island University with a bachelor’s in pharmacy/pharmaceutical sciences.
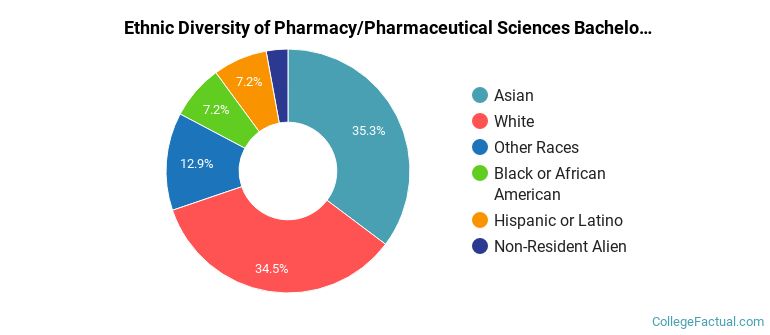
| Ethnic Background | Number of Students |
|---|---|
| Asian | 49 |
| Black or African American | 10 |
| Hispanic or Latino | 10 |
| White | 48 |
| Non-Resident Aliens | 4 |
| Other Races | 18 |
Long Island University conferred 139 bachelor’s degrees in pharmacy, pharmaceutical sciences, and administration, other in the most recent reporting year — 72% to women and 28% to men. Most of these graduates identified as Asian (35%).
This program is also offered at the graduate level at Long Island University. The following graduate award levels are reported.
| Graduate Level | Annual Graduates |
|---|---|
| Master’s Degrees in Pharmacy/Pharmaceutical Sciences | 94 |
| Doctoral Degrees in Pharmacy/Pharmaceutical Sciences | 5 |
More about our data sources and methodologies.
