Explore the best ranked schools for the programs you are most interested in.
Lorenzo Walker Technical College was not ranked in College Factual's 2025 Best Overall Colleges report. This could be for a number of reasons, including lack of data.
See all of the rankings for Lorenzo Walker Technical College.
If you are worried about getting into Lorenzo Walker Technical College, don't be. The school has a liberal open admissions policy, which means you only need to meet basic requirements in order to be admitted. Still, be sure to submit a complete application and provide any other requested materials.
The student to faculty ratio is often used as a measure to gauge how much access students will have to their professors - the lower the number, the better. At Lorenzo Walker Technical College, this rate is 20 to 1, which is high when compared to the national average of 15 to 1.
The freshmen retention rate of 73% tells us that most first-year, full-time students like Lorenzo Walker Technical College enough to come back for another year. This is a fair bit higher than the national average of 68%. That's certainly something to check off in the good column about the school.
During the 2017-2018 academic year, there were 736 undergraduates at Lorenzo Walker Technical College with 454 being full-time and 282 being part-time.
The net price is calculated by adding tuition, room, board and other costs and subtracting financial aid.Note that the net price is typically less than the published for a school. For more information on the sticker price of Lorenzo Walker Technical College, see our tuition and fees and room and board pages.
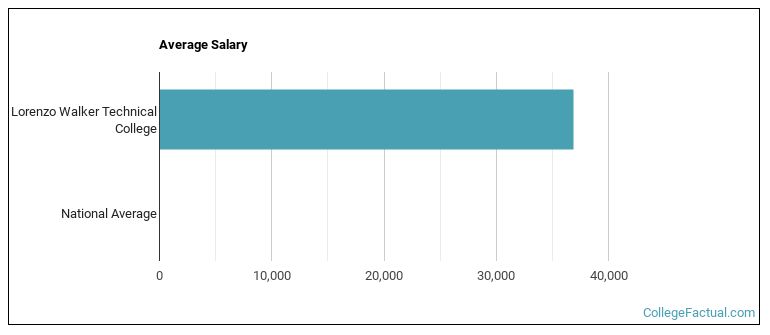
See which majors at Lorenzo Walker Technical College make the most money.
Get more details about the location of Lorenzo Walker Technical College.

Contact details for Lorenzo Walker Technical College are given below.
| Contact Details | |
|---|---|
| Address: | 3702 Estey Avenue, Naples, FL 34104-4405 |
| Phone: | 239-377-0900 |
| Website: | lwtc.edu/ |
| Most Popular Majors | Bachelor’s Degrees | Average Salary of Graduates |
|---|---|---|
| Practical Nursing & Nursing Assistants | 113 | NA |
| Vehicle Maintenance & Repair | 55 | NA |
| Cosmetology | 54 | NA |
| Clinical/Medical Laboratory Science | 33 | NA |
| Environmental Control Technology | 26 | NA |
| Veterinary/Animal Health Technologies/Technicians | 22 | NA |
| Dental Support Services | 21 | NA |
| Computer Programming | 20 | NA |
| Allied Health Professions | 20 | NA |
| Radio, Television & Digital Communication | 18 | NA |
Footnotes
*The racial-ethnic minorities count is calculated by taking the total number of students and subtracting white students, international students, and students whose race/ethnicity was unknown. This number is then divided by the total number of students at the school to obtain the racial-ethnic minorities percentage.
References
More about our data sources and methodologies.