LSU Health - Shreveport total enrollment is approximately 982 students. 22 are undergraduates and 870 are graduate students.
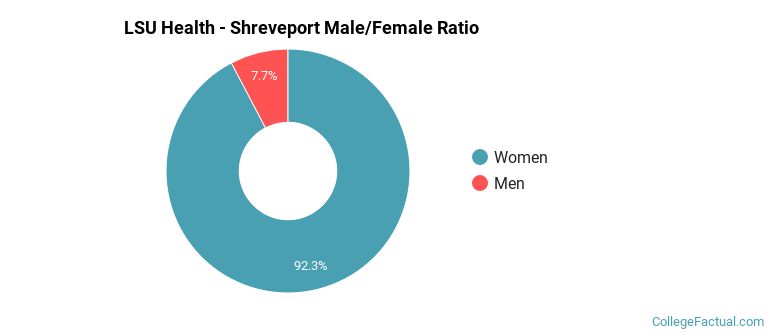
Male/Female Breakdown of Undergraduates
The full-time LSU Health - Shreveport undergraduate population is made up of 82% women, and 18% men.
For the gender breakdown for all students, go here.
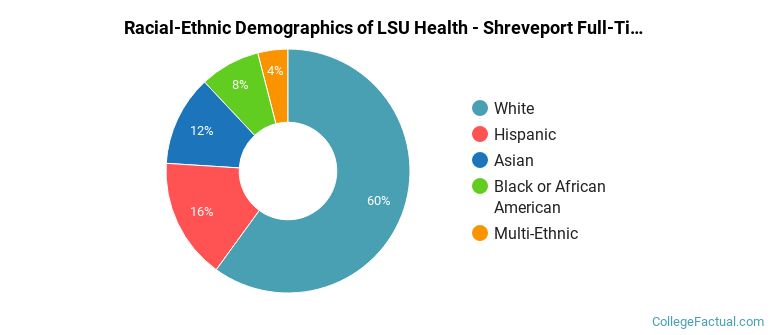
LSU Health - Shreveport Racial/Ethnic Breakdown of Undergraduates
| Race/Ethnicity | Number |
|---|---|
| White | 14 |
| Black or African American | 5 |
| Hispanic | 2 |
| Asian | 1 |
| Native Hawaiian or Pacific Islander | 0 |
| International | 0 |
| Multi-Ethnic | 0 |
| Unknown | 0 |
See racial/ethnic breakdown for all students.
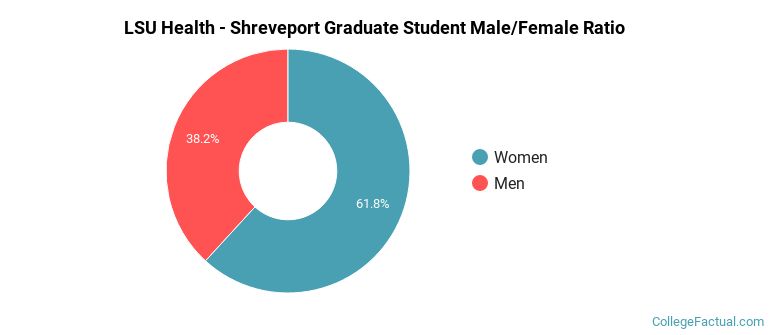
Male/Female Breakdown of Graduate Students
About 61% of full-time grad students are women, and 39% men.
For the gender breakdown for all students, go here.
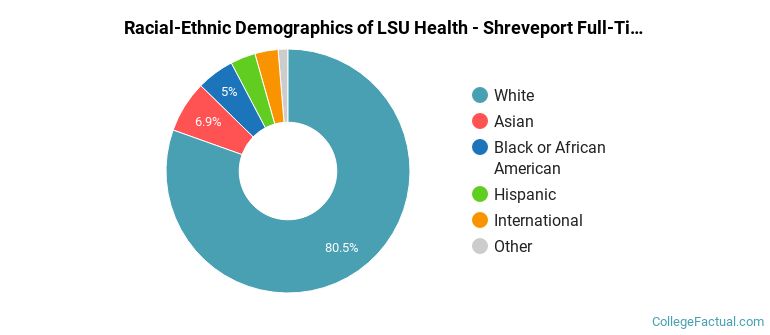
LSU Health - Shreveport Racial-Ethnic Breakdown of Graduate Students
| Race/Ethnicity | Number |
|---|---|
| White | 697 |
| Asian | 63 |
| Black or African American | 41 |
| International | 27 |
| Hispanic | 26 |
| Multi-Ethnic | 9 |
| Unknown | 5 |
| Native Hawaiian or Pacific Islander | 0 |
See racial/ethnic breakdown for all students.
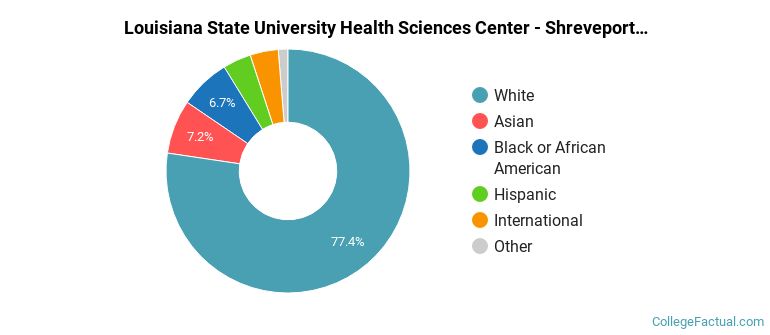
| Race/Ethnicity | Number |
|---|---|
| White | 747 |
| Black or African American | 79 |
| Asian | 69 |
| International | 38 |
| Hispanic | 30 |
| Multi-Ethnic | 9 |
| Unknown | 8 |
| Native Hawaiian or Pacific Islander | 0 |
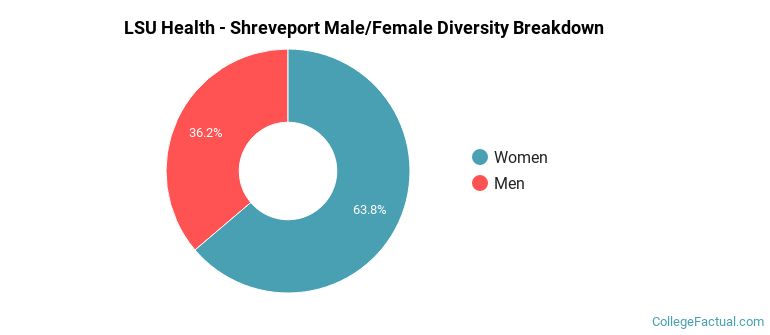
There are approximately 624 female students and 358 male students at LSU Health - Shreveport.
A traditional college student is defined as being between the ages of 18-21. At LSU Health - Shreveport, 1.56% of students fall into that category, compared to the national average of 60%.
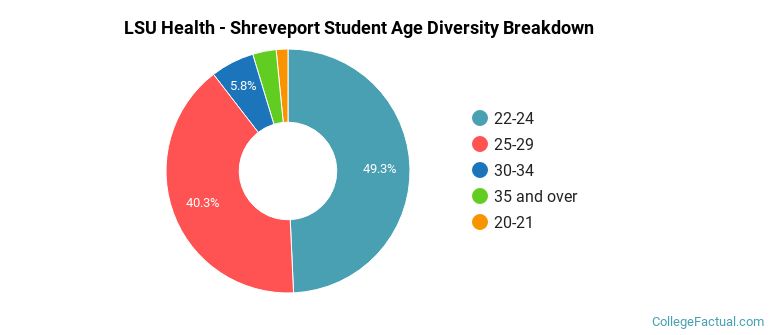
| Student Age Group | Amount |
|---|---|
| 22-24 | 443 |
| 25-29 | 362 |
| 30-34 | 52 |
| 35 and over | 28 |
| 20-21 | 14 |
| 18-19 | 0 |
| Under 18 | 0 |
Footnotes
*The racial-ethnic minorities count is calculated by taking the total number of students and subtracting white students, international students, and students whose race/ethnicity was unknown. This number is then divided by the total number of students at the school to obtain the racial-ethnic minorities percentage.
References
Department of Homeland Security Citizenship and Immigration Services
Image Credit: By Billy Hathorn under License
Learn more about how College Factual creates their Diversity Rankings.