Louisiana Tech total enrollment is approximately 11,126 students. 7,854 are undergraduates and 716 are graduate students.
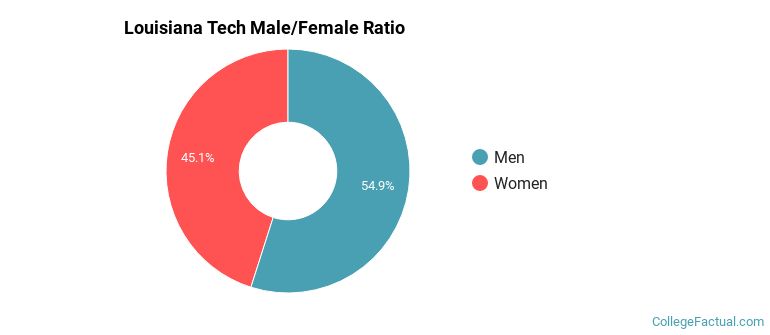
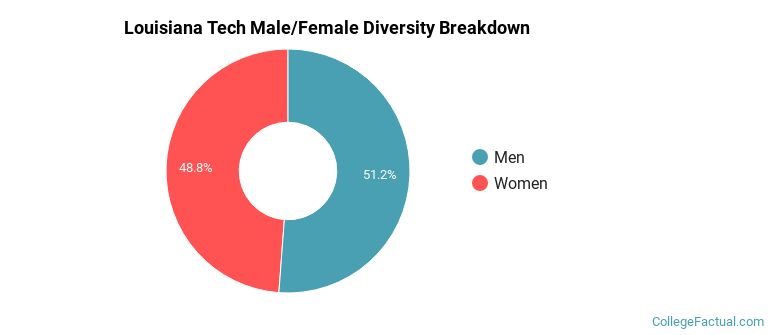
Male/Female Breakdown of Undergraduates
The full-time Louisiana Tech undergraduate population is made up of 45% women, and 55% men.
For the gender breakdown for all students, go here.
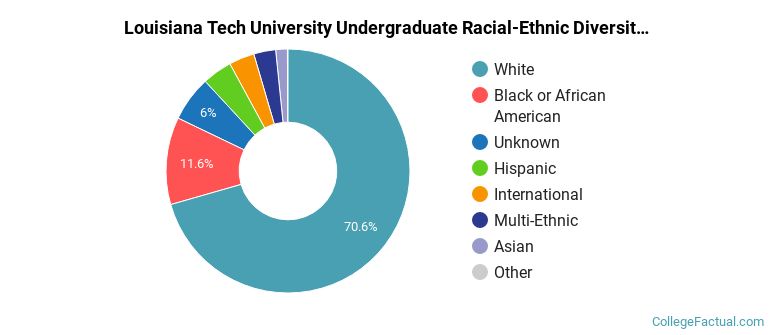
Louisiana Tech Racial/Ethnic Breakdown of Undergraduates
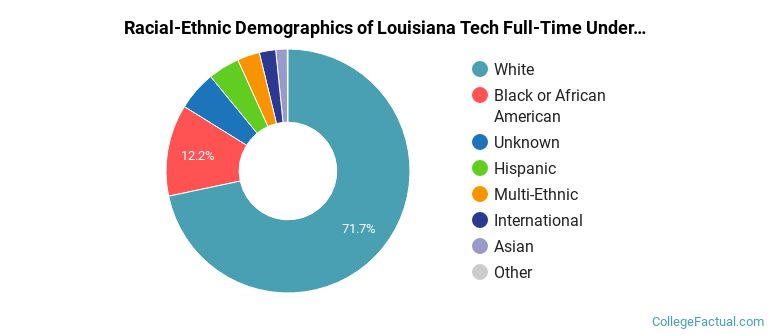
| Race/Ethnicity | Number |
|---|---|
| White | 5,727 |
| Black or African American | 871 |
| Unknown | 409 |
| Hispanic | 333 |
| Multi-Ethnic | 240 |
| International | 135 |
| Asian | 102 |
| Native Hawaiian or Pacific Islander | 4 |
See racial/ethnic breakdown for all students.
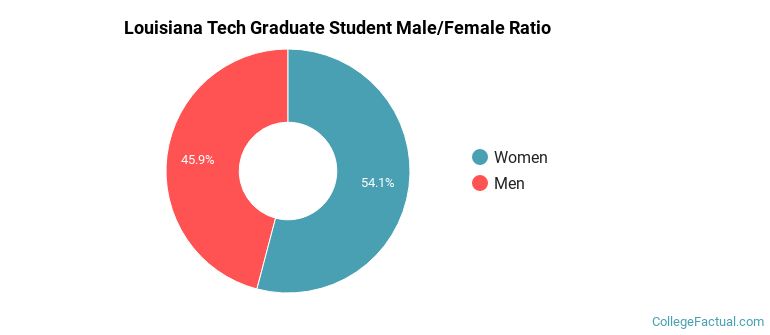
Male/Female Breakdown of Graduate Students
About 56% of full-time grad students are women, and 44% men.
For the gender breakdown for all students, go here.
Louisiana Tech Racial-Ethnic Breakdown of Graduate Students
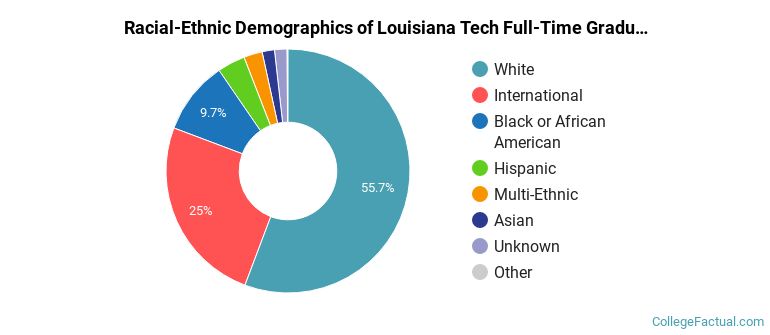
| Race/Ethnicity | Number |
|---|---|
| White | 448 |
| International | 131 |
| Black or African American | 73 |
| Hispanic | 29 |
| Asian | 14 |
| Multi-Ethnic | 12 |
| Unknown | 7 |
| Native Hawaiian or Pacific Islander | 1 |
See racial/ethnic breakdown for all students.
| Race/Ethnicity | Number |
|---|---|
| White | 7,932 |
| Black or African American | 1,240 |
| Unknown | 681 |
| Hispanic | 434 |
| Multi-Ethnic | 331 |
| International | 300 |
| Asian | 154 |
| Native Hawaiian or Pacific Islander | 7 |
There are approximately 5,440 female students and 5,686 male students at Louisiana Tech.
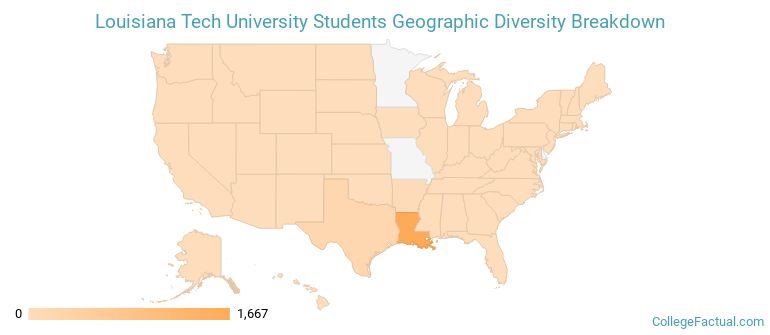
Louisiana Tech ranks 1,048 out of 2,183 when it comes to geographic diversity.
16.61% of Louisiana Tech students come from out of state, and 0% come from out of the country.
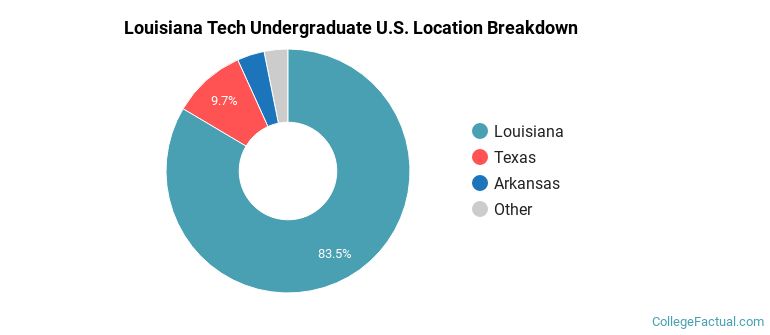
The undergraduate student body is split among 24 states (may include Washington D.C.). Click on the map for more detail.
| State | Amount |
|---|---|
| Louisiana | 1,667 |
| Texas | 194 |
| Arkansas | 72 |
| Mississippi | 16 |
| Florida | 6 |
Students from 71 countries are represented at this school, with the majority of the international students coming from China, India, and Nepal.
Learn more about international students at Louisiana Tech.
A traditional college student is defined as being between the ages of 18-21. At Louisiana Tech, 51.66% of students fall into that category, compared to the national average of 60%.
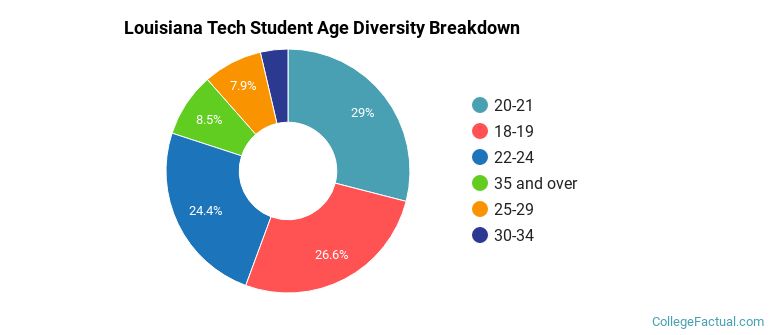
| Student Age Group | Amount |
|---|---|
| 20-21 | 3,458 |
| 18-19 | 3,174 |
| 22-24 | 2,908 |
| 35 and over | 1,011 |
| 25-29 | 936 |
| 30-34 | 435 |
| Under 18 | 0 |
Footnotes
*The racial-ethnic minorities count is calculated by taking the total number of students and subtracting white students, international students, and students whose race/ethnicity was unknown. This number is then divided by the total number of students at the school to obtain the racial-ethnic minorities percentage.
References
Department of Homeland Security Citizenship and Immigration Services
Image Credit: By Billy Hathorn under License
Learn more about how College Factual creates their Diversity Rankings.