Explore the best ranked schools for the programs you are most interested in.
Lynchburg was not ranked in College Factual's 2025 Best Overall Colleges report. This could be for a number of reasons, including lack of data.
Because it has a high acceptance rate of 96%, some consider Lynchburg to be a safety school. But don't just assume that admittance is in the bag. Make sure to spend enough time on your application so that it is in tip-top shape.
About 23% of students accepted to Lynchburg submitted their SAT scores. When looking at the 25th through the 75th percentile, SAT Evidence-Based Reading and Writing scores ranged between 500 and 620. Math scores were between 500 and 610.
The student to faculty ratio at Lynchburg is an impressive 10 to 1. That's quite good when you compare it to the national average of 15 to 1. This is a good sign that students at the school will have more opportunities for one-on-one interactions with their professors.
Another measure that is often used to estimate how much access students will have to their professors is how many faculty members are full-time. The idea here is that part-time faculty tend to spend less time on campus, so they may not be as available to students as full-timers.
The full-time faculty percentage at University of Lynchburg is 75%. This is higher than the national average of 47%.
University of Lynchburg has a freshmen retention rate of 76%. That's a good sign that full-time students like the school and their professors enough to want to stick around for another year. It's also a sign that the admissions team did a good job in choosing applicants who were a good fit for the school.
The on-time graduation rate for someone pursuing a bachelor's degree is typically four years. This rate at Lynchburg for first-time, full-time students is 50%, which is better than the national average of 33.3%.
Find out more about the retention and graduation rates at University of Lynchburg.
During the 2017-2018 academic year, there were 1,822 undergraduates at Lynchburg with 1,764 being full-time and 58 being part-time.
| $0-30 K | $30K-48K | $48-75 | $75-110K | $110K + |
|---|---|---|---|---|
| $18,808 | $17,190 | $20,130 | $23,584 | $25,213 |
The net price is calculated by adding tuition, room, board and other costs and subtracting financial aid.Note that the net price is typically less than the published for a school. For more information on the sticker price of Lynchburg, see our tuition and fees and room and board pages.
It's not uncommon for college students to take out loans to pay for school. In fact, almost 66% of students nationwide depend at least partially on loans. At Lynchburg, approximately 64% of students took out student loans averaging $7,258 a year. That adds up to $29,032 over four years for those students.
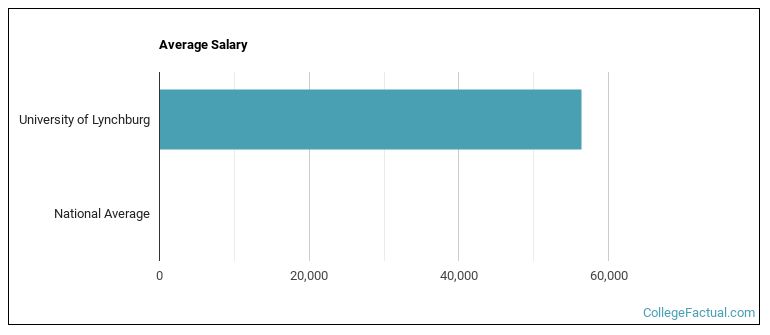
See which majors at University of Lynchburg make the most money.
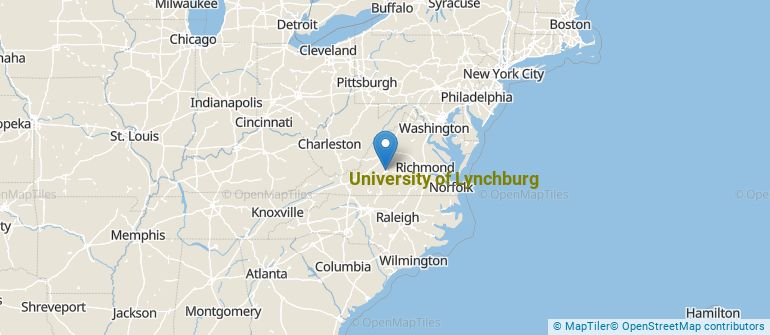
Get more details about the location of University of Lynchburg.
Contact details for Lynchburg are given below.
| Contact Details | |
|---|---|
| Address: | 1501 Lakeside Dr, Lynchburg, VA 24501-3113 |
| Phone: | 434-544-8100 |
| Website: | www.lynchburg.edu/ |
| Most Popular Majors | Bachelor’s Degrees | Average Salary of Graduates |
|---|---|---|
| Allied Health Professions | 398 | NA |
| Business Administration & Management | 69 | NA |
| Public Health | 52 | NA |
| Nursing | 44 | NA |
| Physiology & Pathology Sciences | 40 | NA |
| Rehabilitation & Therapeutic Professions | 40 | NA |
| Criminology | 38 | NA |
| General Biology | 29 | NA |
| General Psychology | 29 | NA |
| Health & Medical Administrative Services | 27 | NA |
Online learning is becoming popular at even the oldest colleges and universities in the United States. Not only are online classes great for returning adults with busy schedules, they are also frequented by a growing number of traditional students.
In 2022-2023, 868 students took at least one online class at University of Lynchburg. This is a decrease from the 1,266 students who took online classes the previous year.
| Year | Took at Least One Online Class | Took All Classes Online |
|---|---|---|
| 2022-2023 | 868 | 416 |
| 2021-2022 | 1,266 | 511 |
| 2020-2021 | 2,225 | 400 |
| 2018-2019 | 674 | 503 |
Learn more about online learning at University of Lynchburg.
If you’re considering University of Lynchburg, here are some more schools you may be interested in knowing more about.
Curious on how these schools stack up against Lynchburg? Pit them head to head with College Combat, our free interactive tool that lets you compare college on the features that matter most to you!
Footnotes
*The racial-ethnic minorities count is calculated by taking the total number of students and subtracting white students, international students, and students whose race/ethnicity was unknown. This number is then divided by the total number of students at the school to obtain the racial-ethnic minorities percentage.
References
More about our data sources and methodologies.