Manhattanville total enrollment is approximately 2,408 students. 1,333 are undergraduates and 357 are graduate students.
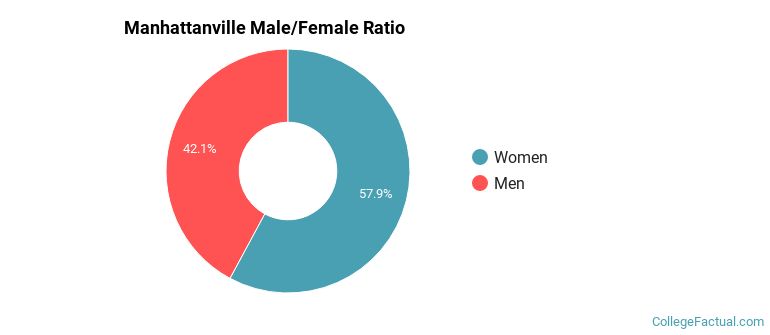
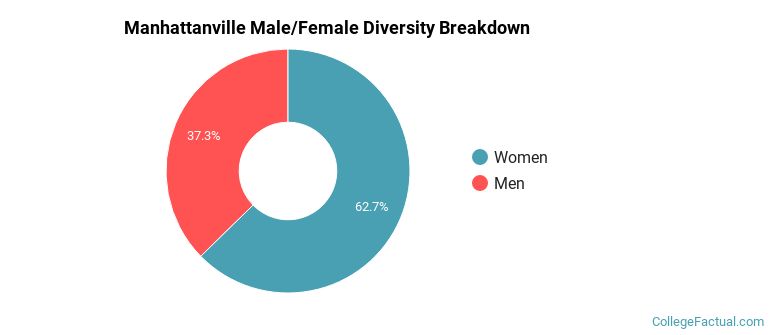
Male/Female Breakdown of Undergraduates
The full-time Manhattanville undergraduate population is made up of 59% women, and 41% men.
For the gender breakdown for all students, go here.
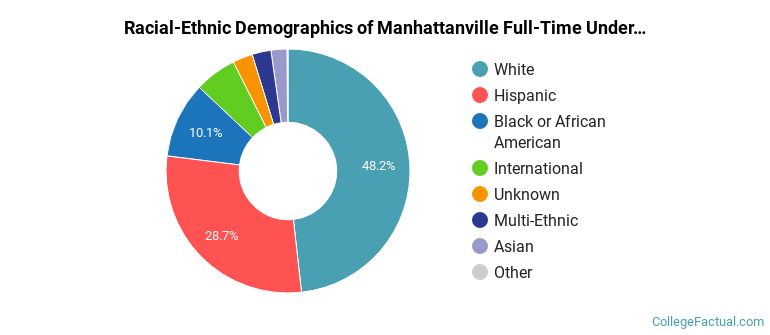
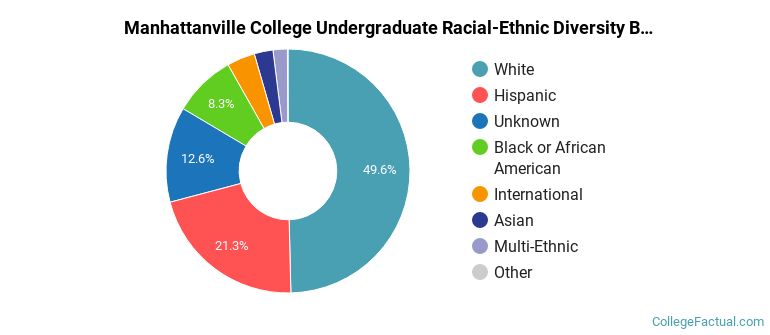
Manhattanville Racial/Ethnic Breakdown of Undergraduates
| Race/Ethnicity | Number |
|---|---|
| White | 676 |
| Hispanic | 394 |
| Black or African American | 136 |
| International | 38 |
| Unknown | 31 |
| Multi-Ethnic | 27 |
| Asian | 26 |
| Native Hawaiian or Pacific Islander | 5 |
See racial/ethnic breakdown for all students.
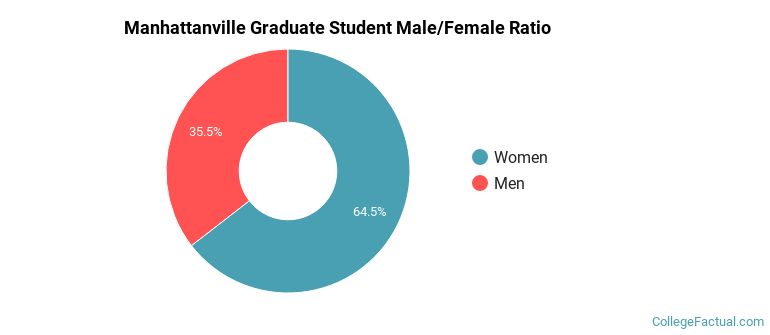
Male/Female Breakdown of Graduate Students
About 55% of full-time grad students are women, and 45% men.
For the gender breakdown for all students, go here.
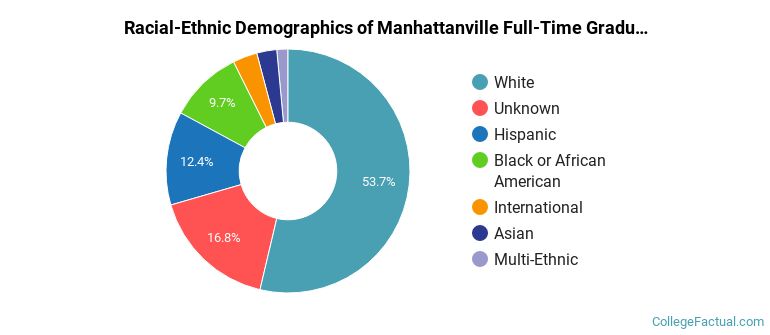
Manhattanville Racial-Ethnic Breakdown of Graduate Students
| Race/Ethnicity | Number |
|---|---|
| White | 187 |
| Unknown | 57 |
| Hispanic | 56 |
| Black or African American | 34 |
| International | 10 |
| Asian | 6 |
| Multi-Ethnic | 6 |
| Native Hawaiian or Pacific Islander | 1 |
See racial/ethnic breakdown for all students.
| Race/Ethnicity | Number |
|---|---|
| White | 1,263 |
| Hispanic | 524 |
| Unknown | 267 |
| Black or African American | 202 |
| International | 50 |
| Asian | 49 |
| Multi-Ethnic | 41 |
| Native Hawaiian or Pacific Islander | 9 |
There are approximately 1,514 female students and 894 male students at Manhattanville.
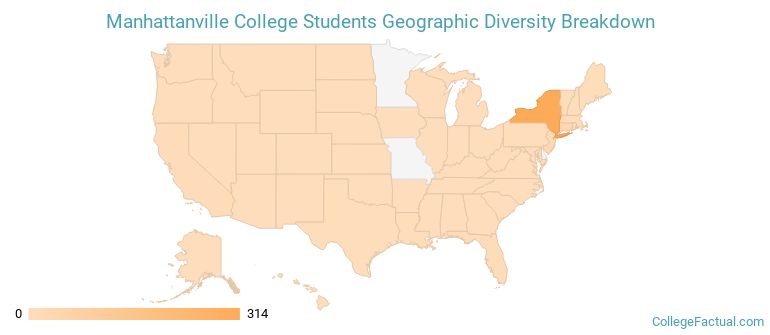
Manhattanville ranks 812 out of 2,183 when it comes to geographic diversity.
27.98% of Manhattanville students come from out of state, and 9.48% come from out of the country.
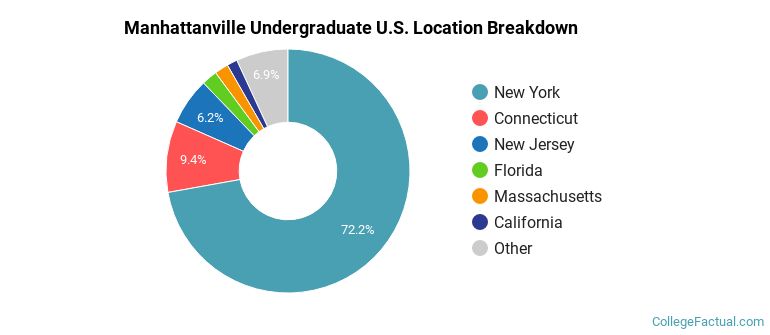
The undergraduate student body is split among 20 states (may include Washington D.C.). Click on the map for more detail.
| State | Amount |
|---|---|
| New York | 314 |
| Connecticut | 41 |
| New Jersey | 27 |
| Florida | 9 |
| Massachusetts | 8 |
Students from 65 countries are represented at this school, with the majority of the international students coming from Canada, Dominican Republic, and Georgia.
Learn more about international students at Manhattanville.
A traditional college student is defined as being between the ages of 18-21. At Manhattanville, 52.64% of students fall into that category, compared to the national average of 60%.
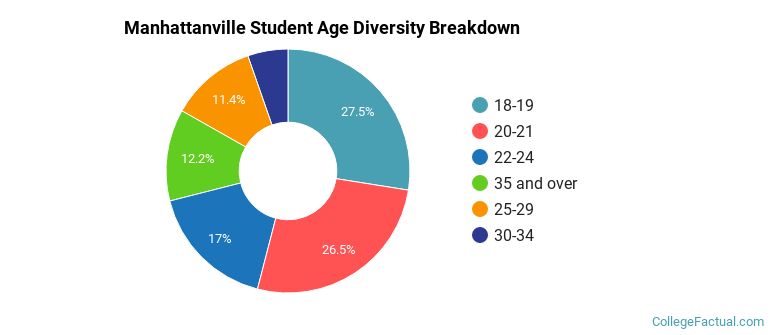
| Student Age Group | Amount |
|---|---|
| 18-19 | 721 |
| 20-21 | 695 |
| 22-24 | 446 |
| 35 and over | 319 |
| 25-29 | 300 |
| 30-34 | 140 |
| Under 18 | 0 |
Footnotes
*The racial-ethnic minorities count is calculated by taking the total number of students and subtracting white students, international students, and students whose race/ethnicity was unknown. This number is then divided by the total number of students at the school to obtain the racial-ethnic minorities percentage.
References
Department of Homeland Security Citizenship and Immigration Services
Read College Factual's Diversity Ranking Methodology.