Below are the key facts about this program at MICA. Degrees are awarded at the Bachelor’s level, with graduate study also available. It ranks as high as #7 out of 8 schools (Bachelor’s level) by College Factual. Jump to any of the following sections:
College Factual rates MICA among the top schools in the country for fine & studio arts, placing at #302 out of 664 schools nationally.
| Ranking | Rank |
|---|---|
| Best Fine & Studio Arts Schools | 302 of 664 |
| Best Fine & Studio Arts Schools in Maryland | 8 of 10 |
| Best Fine & Studio Arts Schools in the Middle Atlantic Region | 72 of 122 |
The table below lists every degree level offered in fine & studio arts at MICA, along with how many graduates complete each level annually.
| Degree Level | Annual Graduates |
|---|---|
| Bachelor’s | 113 |
| Master’s | 33 |
During the most recent reporting year, Maryland Institute College of Art handed out 113 bachelor’s degrees in fine & studio arts.
MICA is among the very best schools in the country for fine & studio arts at the bachelor’s level. Its best result was #7 out of 8 schools by College Factual.
Fine & Studio Arts majors who earn their bachelor’s degree from MICA earn a median of $29,460 a year. This is below $54,505, the median for all majors at MICA.
To complete a bachelor’s at MICA, fine & studio arts students accumulate a median of $27,000 in student loans. This is higher than $27,000, the typical median for all majors at MICA.

Information about average full-time undergraduate tuition and fees is shown in the table below.
| In State | Out of State | |
|---|---|---|
| Tuition | $50,160 | $54,750 |
| Fees | $2,050 | $2,050 |
Read more about MICA tuition and fees.
Among recent graduates, 19% of fine & studio arts bachelor’s degrees went to men and 81% went to women.
 The largest share of fine & studio arts bachelor’s degree graduates at MICA are White. Roughly 40% of graduates fell into this category.
The following table and chart show the ethnic background for students who recently graduated from Maryland Institute College of Art with a bachelor’s in fine & studio arts.
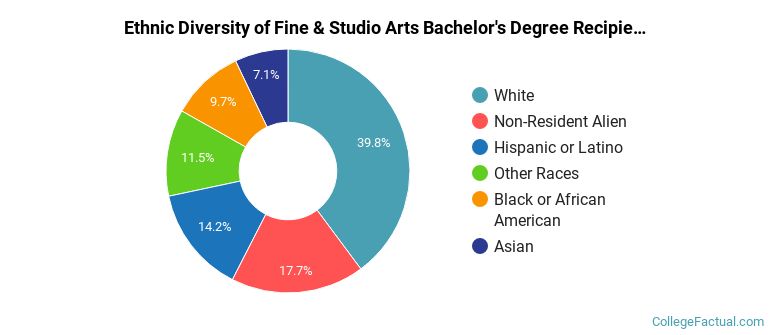
| Ethnic Background | Number of Students |
|---|---|
| Asian | 8 |
| Black or African American | 11 |
| Hispanic or Latino | 16 |
| White | 45 |
| Non-Resident Aliens | 20 |
| Other Races | 13 |
MICA conferred 48 bachelor’s degrees in intermedia/multimedia in the most recent reporting year — 81% to women and 19% to men. The largest share of these graduates were White (40%).
MICA granted 16 bachelor’s completions in fiber, textile and weaving arts in the latest year of data — 88% to women and 12% to men. The most common background among these graduates was White (38%).
MICA granted 16 bachelor’s completions in painting in the latest year of data — 69% to women and 31% to men. The most common background among these graduates was White (38%).
MICA conferred 13 bachelor’s completions in sculpture in the most recent reporting year — 77% to women and 23% to men. The largest share of these graduates were White (46%).
MICA awarded 9 bachelor’s completions in ceramic arts and ceramics in the latest year of data — 100% to women and 0% to men. Most of these graduates identified as Hispanic or Latino (33%).
MICA conferred 5 bachelor’s completions in printmaking recently — 60% to women and 40% to men. The most common background among these graduates was White (40%).
MICA granted 3 bachelor’s degrees in art/art studies, general in the most recent reporting year — 100% to women and 0% to men. The largest share of these graduates were Asian (33%).
MICA conferred 2 bachelor’s degrees in drawing in the most recent reporting year — 100% to women and 0% to men. The largest share of these graduates were White (100%).
MICA granted 1 bachelor’s degree in fine arts and art studies, other in the latest year of data — 100% to women and 0% to men. Most of these graduates identified as Asian (100%).
You can also pursue this field at the graduate level at MICA. The following graduate award levels are reported.
| Graduate Level | Annual Graduates |
|---|---|
| Master’s Degrees in Fine & Studio Arts | 33 |
