Explore the best ranked schools for the programs you are most interested in.
MCU was not ranked in College Factual's Best Overall Colleges report this year. This may be because not enough data was available.
See all of the rankings for Marymount California University.
Data for the student to faculty ratio for this school has not been reported.
During the 2017-2018 academic year, there were 515 undergraduates at MCU with 504 being full-time and 11 being part-time.
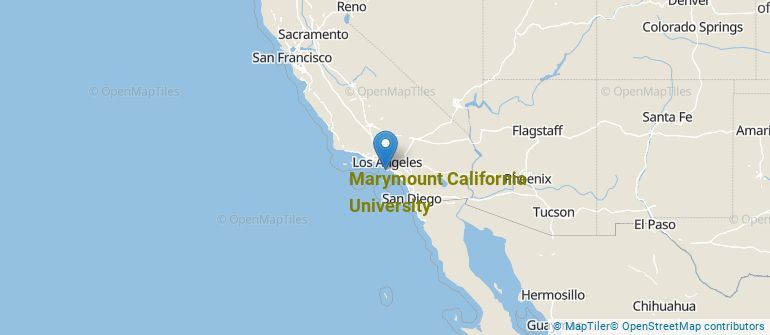
Get more details about the location of Marymount California University.
Contact details for MCU are given below.
| Contact Details |
|---|
| Most Popular Majors | Bachelor’s Degrees | Average Salary of Graduates |
|---|---|---|
| Business Administration & Management | 45 | $23,972 |
| Liberal Arts General Studies | 45 | $24,862 |
| General Psychology | 45 | $30,624 |
| General Business/Commerce | 31 | NA |
| General Biology | 13 | NA |
| Criminal Justice & Corrections | 11 | $31,374 |
| Radio, Television & Digital Communication | 9 | NA |
| Accounting | 2 | NA |
| General Visual & Performing Arts | 2 | NA |
| Clinical, Counseling & Applied Psychology | 0 | NA |
This is a decrease from the 421 students who took online classes the previous year.
Learn more about online learning at Marymount California University.
Footnotes
*The racial-ethnic minorities count is calculated by taking the total number of students and subtracting white students, international students, and students whose race/ethnicity was unknown. This number is then divided by the total number of students at the school to obtain the racial-ethnic minorities percentage.
References
More about our data sources and methodologies.