Marymount total enrollment is approximately 3,294 students. 1,861 are undergraduates and 693 are graduate students.
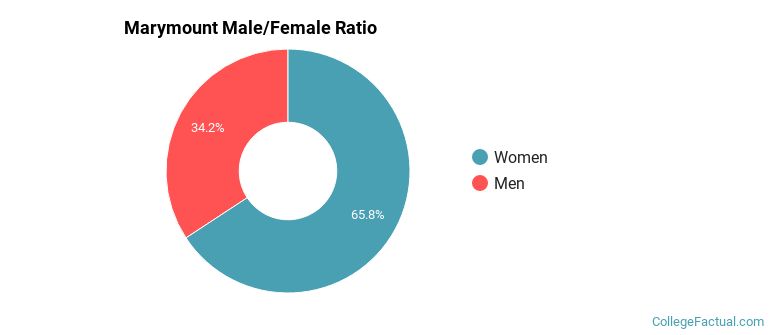
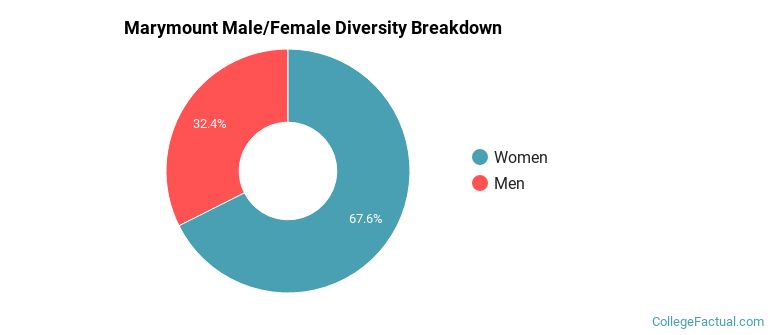
Male/Female Breakdown of Undergraduates
The full-time Marymount undergraduate population is made up of 65% women, and 35% men.
For the gender breakdown for all students, go here.
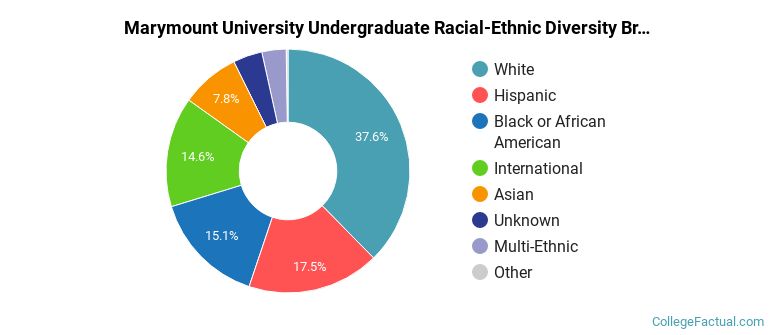
Marymount Racial/Ethnic Breakdown of Undergraduates
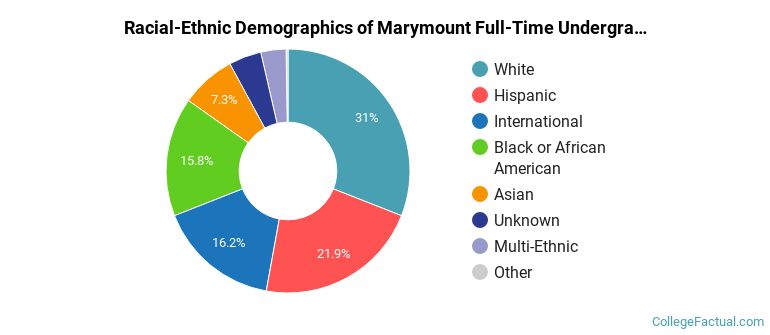
| Race/Ethnicity | Number |
|---|---|
| White | 564 |
| Hispanic | 472 |
| Black or African American | 296 |
| International | 258 |
| Asian | 123 |
| Multi-Ethnic | 85 |
| Unknown | 53 |
| Native Hawaiian or Pacific Islander | 6 |
See racial/ethnic breakdown for all students.
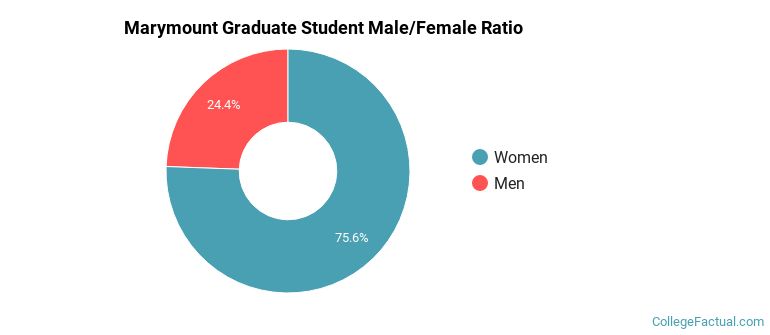
Male/Female Breakdown of Graduate Students
About 74% of full-time grad students are women, and 26% men.
For the gender breakdown for all students, go here.
Marymount Racial-Ethnic Breakdown of Graduate Students
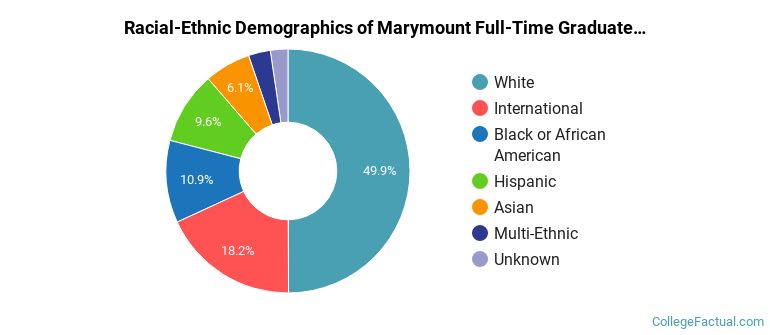
| Race/Ethnicity | Number |
|---|---|
| White | 342 |
| International | 109 |
| Black or African American | 85 |
| Hispanic | 75 |
| Asian | 38 |
| Multi-Ethnic | 24 |
| Unknown | 20 |
| Native Hawaiian or Pacific Islander | 0 |
See racial/ethnic breakdown for all students.
| Race/Ethnicity | Number |
|---|---|
| White | 1,225 |
| Hispanic | 654 |
| Black or African American | 507 |
| International | 432 |
| Asian | 237 |
| Multi-Ethnic | 130 |
| Unknown | 97 |
| Native Hawaiian or Pacific Islander | 6 |
There are approximately 2,196 female students and 1,098 male students at Marymount.
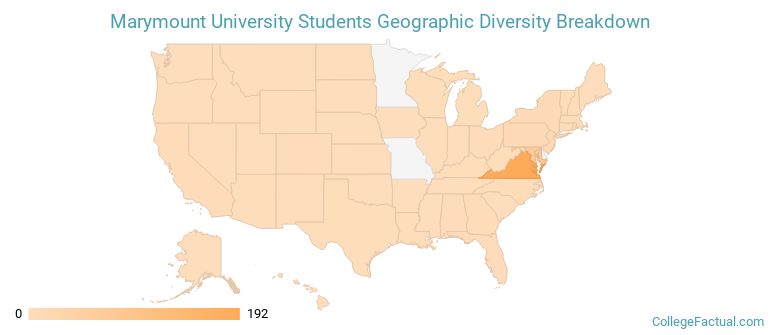
Marymount ranks 538 out of 2,183 when it comes to geographic diversity.
49.61% of Marymount students come from out of state, and 13.57% come from out of the country.
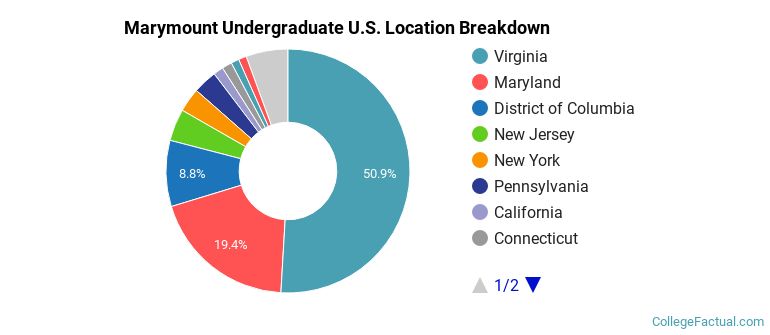
The undergraduate student body is split among 25 states (may include Washington D.C.). Click on the map for more detail.
| State | Amount |
|---|---|
| Virginia | 192 |
| Maryland | 73 |
| District of Columbia | 33 |
| New Jersey | 16 |
| New York | 12 |
Students from 76 countries are represented at this school, with the majority of the international students coming from Saudi Arabia, India, and Vietnam.
Learn more about international students at Marymount.
A traditional college student is defined as being between the ages of 18-21. At Marymount, 38.99% of students fall into that category, compared to the national average of 60%.
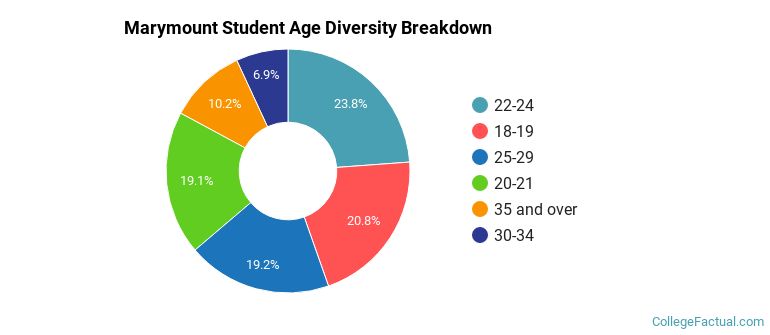
| Student Age Group | Amount |
|---|---|
| 22-24 | 787 |
| 18-19 | 686 |
| 25-29 | 633 |
| 20-21 | 630 |
| 35 and over | 338 |
| 30-34 | 228 |
| Under 18 | 0 |
Footnotes
*The racial-ethnic minorities count is calculated by taking the total number of students and subtracting white students, international students, and students whose race/ethnicity was unknown. This number is then divided by the total number of students at the school to obtain the racial-ethnic minorities percentage.
References
Department of Homeland Security Citizenship and Immigration Services
Image Credit: By Kevin Bowman under License
Read College Factual's Diversity Ranking Methodology.