Marywood total enrollment is approximately 2,613 students. 1,680 are undergraduates and 678 are graduate students.
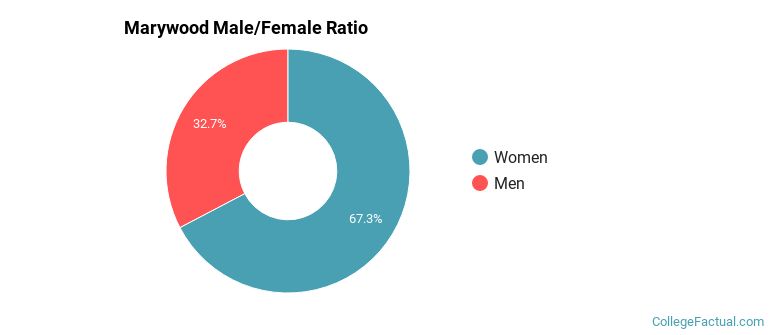
Male/Female Breakdown of Undergraduates
The full-time Marywood undergraduate population is made up of 68% women, and 33% men.
For the gender breakdown for all students, go here.
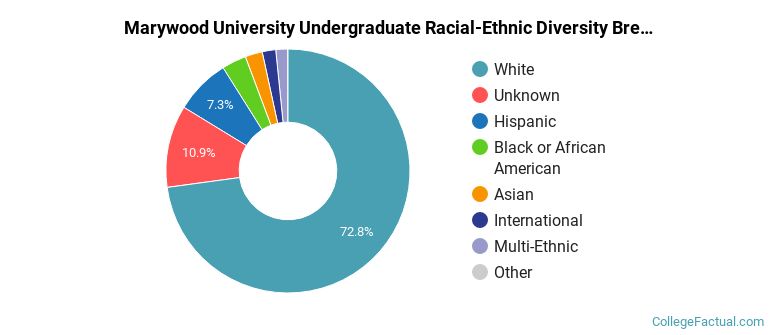
Marywood Racial/Ethnic Breakdown of Undergraduates
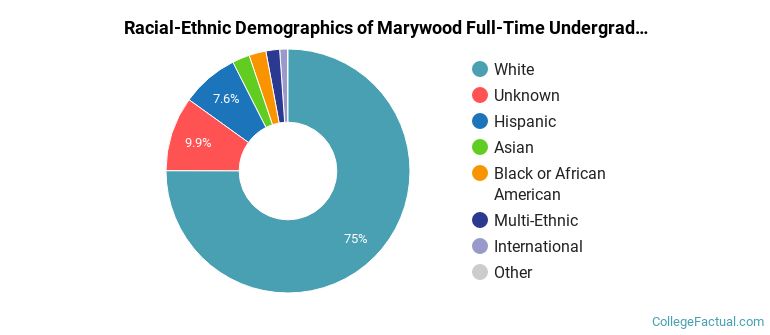
| Race/Ethnicity | Number |
|---|---|
| White | 1,272 |
| Hispanic | 150 |
| Unknown | 128 |
| Asian | 42 |
| Black or African American | 38 |
| Multi-Ethnic | 35 |
| International | 12 |
| Native Hawaiian or Pacific Islander | 1 |
See racial/ethnic breakdown for all students.
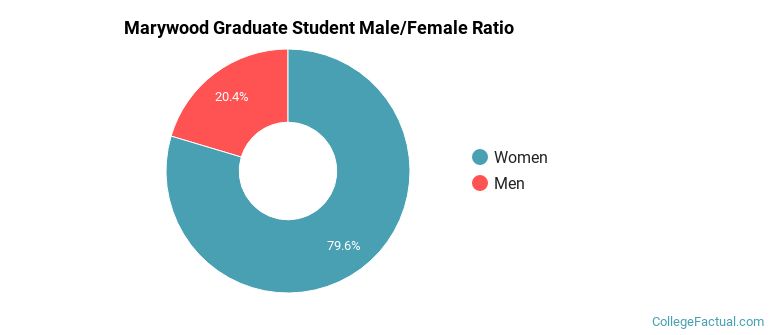
Male/Female Breakdown of Graduate Students
About 79% of full-time grad students are women, and 21% men.
For the gender breakdown for all students, go here.
Marywood Racial-Ethnic Breakdown of Graduate Students
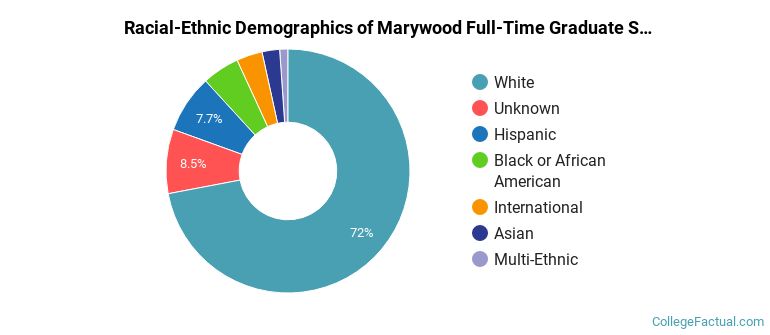
| Race/Ethnicity | Number |
|---|---|
| White | 497 |
| Unknown | 51 |
| Hispanic | 49 |
| Black or African American | 32 |
| Asian | 20 |
| International | 16 |
| Multi-Ethnic | 12 |
| Native Hawaiian or Pacific Islander | 0 |
See racial/ethnic breakdown for all students.
| Race/Ethnicity | Number |
|---|---|
| White | 1,936 |
| Unknown | 229 |
| Hispanic | 213 |
| Black or African American | 80 |
| Asian | 67 |
| Multi-Ethnic | 50 |
| International | 34 |
| Native Hawaiian or Pacific Islander | 1 |

There are approximately 1,839 female students and 774 male students at Marywood.
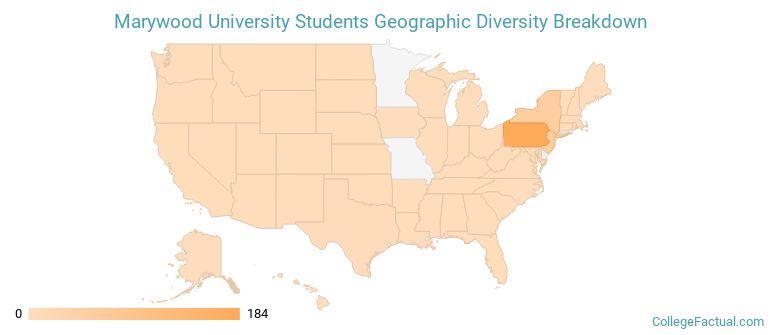
Marywood ranks 1,058 out of 2,183 when it comes to geographic diversity.
42.86% of Marywood students come from out of state, and 0.92% come from out of the country.
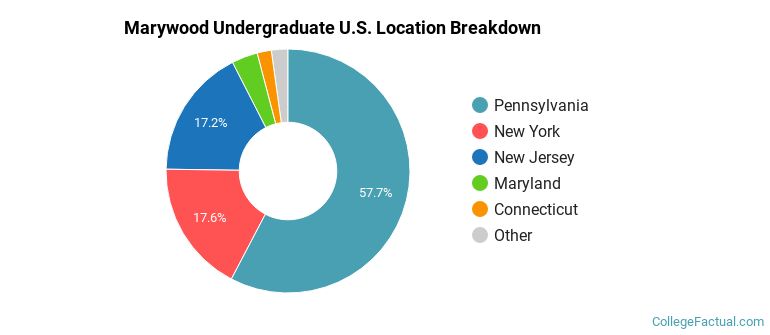
The undergraduate student body is split among 10 states (may include Washington D.C.). Click on the map for more detail.
| State | Amount |
|---|---|
| Pennsylvania | 184 |
| New York | 56 |
| New Jersey | 55 |
| Maryland | 11 |
| Connecticut | 6 |
Students from 19 countries are represented at this school, with the majority of the international students coming from Saudi Arabia, China, and India.
Learn more about international students at Marywood.
A traditional college student is defined as being between the ages of 18-21. At Marywood, 47.50% of students fall into that category, compared to the national average of 60%.
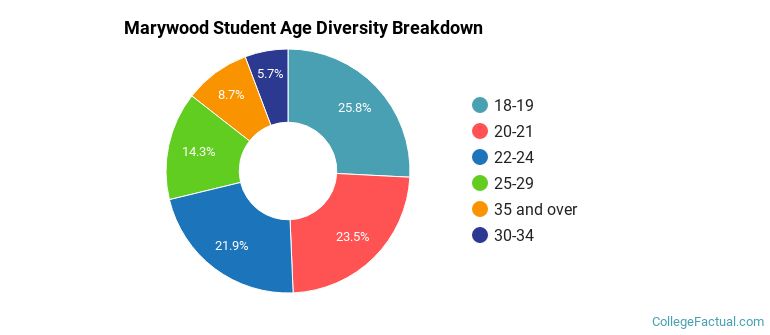
| Student Age Group | Amount |
|---|---|
| 18-19 | 732 |
| 20-21 | 667 |
| 22-24 | 621 |
| 25-29 | 406 |
| 35 and over | 248 |
| 30-34 | 162 |
| Under 18 | 0 |
Footnotes
*The racial-ethnic minorities count is calculated by taking the total number of students and subtracting white students, international students, and students whose race/ethnicity was unknown. This number is then divided by the total number of students at the school to obtain the racial-ethnic minorities percentage.
References