We’ve pulled together the essential facts you should know about the program at MIT, M.I.T.. It is offered at the Bachelor’s level, with graduate study also available. At its best it places at #1 out of 13 schools (Bachelor’s level) by College Factual. Jump to any of the following sections:
College Factual rates MIT, M.I.T. as a strong choice for electrical engineering, ranked #6 out of 307 schools nationally.
| Ranking | Rank |
|---|---|
| Best Electrical Engineering Schools | 6 of 307 |
| Best Electrical Engineering Schools in Massachusetts | 1 of 13 |
| Best Electrical Engineering Schools in the New England Region | 1 of 21 |
Here is each degree level available for electrical engineering at MIT, M.I.T., along with how many graduates complete each level annually.
| Degree Level | Annual Graduates |
|---|---|
| Bachelor’s | 71 |
| Master’s | 108 |
| Doctoral | 51 |
During the most recent reporting year, Massachusetts Institute of Technology conferred 71 bachelor’s degrees in electrical engineering.
MIT, M.I.T. is among the very best schools in the country for electrical engineering at the bachelor’s level. Its best result was #1 out of 13 schools by College Factual.
Electrical Engineering majors who earn their bachelor’s degree from MIT, M.I.T. earn a median of $186,577 a year. This is higher than $156,337, the median for all majors at MIT, M.I.T..
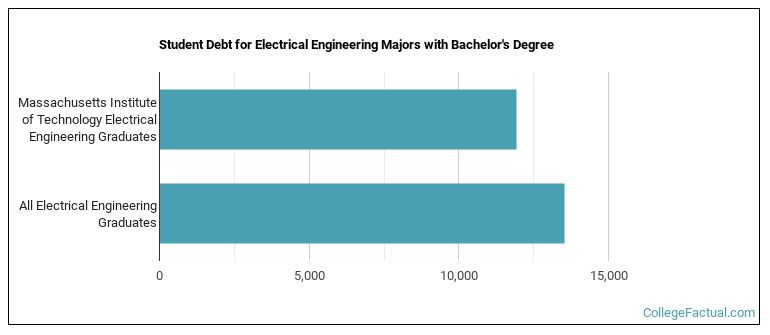
To complete a bachelor’s at MIT, M.I.T., electrical engineering graduates take on a median debt of $11,935 in student loans. This is lower than $13,516, the typical median for all majors at MIT, M.I.T..
The full-time undergraduate tuition and fees are shown below.
| In State | Out of State | |
|---|---|---|
| Tuition | $55,510 | $61,990 |
| Fees | $406 | $406 |
Find out more about MIT, M.I.T. tuition and fees.
For the most recent academic year available, 59% of electrical engineering bachelor’s degrees went to men and 41% went to women.
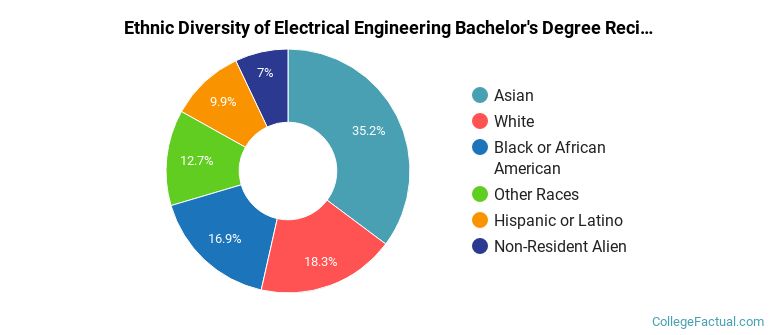
 The largest share of electrical engineering bachelor’s degree graduates at MIT, M.I.T. are Asian. Approximately 35% of graduates fell into this category.
The following table and chart show the ethnic background for students who recently graduated from Massachusetts Institute of Technology with a bachelor’s in electrical engineering.
| Ethnic Background | Number of Students |
|---|---|
| Asian | 25 |
| Black or African American | 12 |
| Hispanic or Latino | 7 |
| White | 13 |
| Non-Resident Aliens | 5 |
| Other Races | 9 |
MIT, M.I.T. conferred 71 bachelor’s degrees in electrical and electronics engineering in the latest year of data — 41% to women and 59% to men. Most of these graduates identified as Asian (35%).
This program is also offered at the graduate level at MIT, M.I.T.. Annual graduate completions by level are shown below.
| Graduate Level | Annual Graduates |
|---|---|
| Master’s Degrees in Electrical Engineering | 108 |
| Doctoral Degrees in Electrical Engineering | 51 |
