Here is an overview of this program at MIT, M.I.T.. It is offered at the Bachelor’s level, with graduate study also available. Its best result is a rank of #1 out of 5 schools (Bachelor’s level) by College Factual. Jump to any of the following sections:
College Factual ranks MIT, M.I.T. highly for applied mathematics, ranked #8 out of 139 schools nationally.
| Ranking | Rank |
|---|---|
| Best Applied Mathematics Schools | 8 of 139 |
| Best Applied Mathematics Schools in Massachusetts | 1 of 12 |
| Best Applied Mathematics Schools in the New England Region | 1 of 20 |
The following degree levels are available for applied mathematics at MIT, M.I.T., along with how many graduates complete each level annually.
| Degree Level | Annual Graduates |
|---|---|
| Bachelor’s | 23 |
| Master’s | 128 |
During the most recent reporting year, Massachusetts Institute of Technology awarded 23 bachelor’s degrees in applied mathematics.
MIT, M.I.T. is among the very best schools in the country for applied mathematics at the bachelor’s level. In particular it placed #1 out of 5 schools by College Factual.
The full-time undergraduate tuition and fees are shown below.
| In State | Out of State | |
|---|---|---|
| Tuition | $55,510 | $61,990 |
| Fees | $406 | $406 |
Find out more about MIT, M.I.T. tuition and fees.
For the most recent academic year available, 57% of applied mathematics bachelor’s degrees went to men and 43% went to women.
 The largest share of applied mathematics bachelor’s degree graduates at MIT, M.I.T. were White. Approximately 43% of graduates fell into this category.
The following table and chart show the ethnic background for students who recently graduated from Massachusetts Institute of Technology with a bachelor’s in applied mathematics.
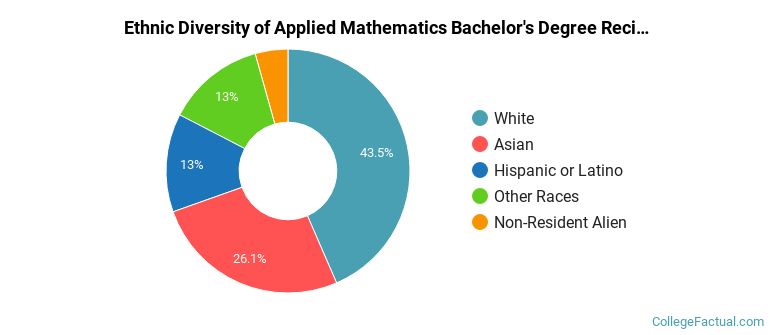
| Ethnic Background | Number of Students |
|---|---|
| Asian | 6 |
| Black or African American | 0 |
| Hispanic or Latino | 3 |
| White | 10 |
| Non-Resident Aliens | 1 |
| Other Races | 3 |
MIT, M.I.T. conferred 23 bachelor’s degrees in financial mathematics recently — 43% to women and 57% to men. Most of these graduates identified as White (43%).
Graduate study is also available at MIT, M.I.T.. Here are the graduate award levels offered.
| Graduate Level | Annual Graduates |
|---|---|
| Master’s Degrees in Applied Mathematics | 128 |