Here, you'll find out more about the major, including such details as the number of graduates, what degree levels are offered, ethnicity of students, and more. We've also included details on how MUSC ranks compared to other colleges offering a major in allied health.
Go directly to any of the following sections:
Learn about start dates, transferring credits, availability of financial aid, and more by contacting the universities below.
Take your associate degree in an allied health field to the next level with this specialized transfer friendly online bachelor of science from Southern New Hampshire University.
Ranked at #9 in College Factual's most recent rankings, MUSC is in the top 1% of the country for allied health students pursuing a bachelor's degree.
In 2022, 86 students received their master’s degree in allied health from MUSC. This makes it the #21 most popular school for allied health master’s degree candidates in the country.
In 2022-2023, the average part-time undergraduate tuition at MUSC was $1,440 per credit hour for out-of-state students. The average for in-state students was $686 per credit hour. Information about average full-time undergraduate tuition and fees is shown in the table below.
| In State | Out of State | |
|---|---|---|
| Tuition | $15,622 | $29,030 |
| Fees | $1,350 | $1,350 |
Learn more about MUSC tuition and fees.
Online degrees for the MUSC allied health bachelor’s degree program are not available at this time. To see if the school offers distance learning options in other areas, visit the MUSC Online Learning page.
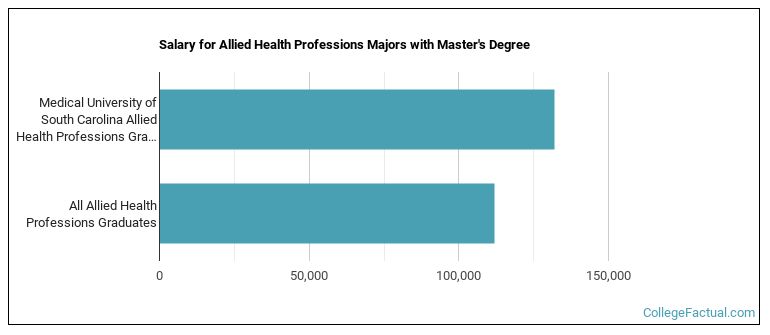
Allied Health majors graduating with a master's degree from MUSC make a median salary of $131,895 a year. This is a better than average outcome since the median salary for all allied health graduates with a master's is $111,759.
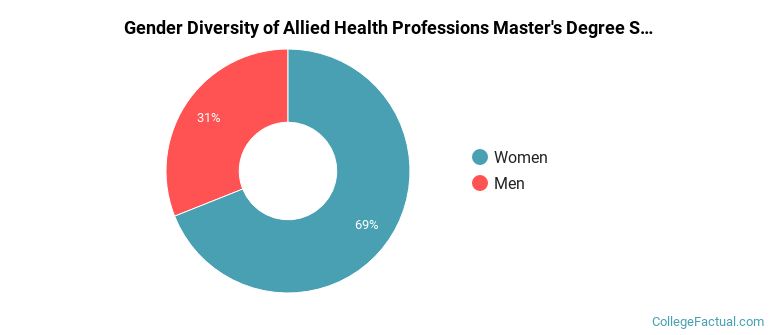
Of the 116 allied health students who graduated with a master's degree in 2021-2022 from MUSC, about 31% were men and 69% were women.
The majority of the students with this major are white. About 72% of 2022 graduates were in this category.
The following table and chart show the ethnic background for students who recently graduated from Medical University of South Carolina with a master's in allied health.
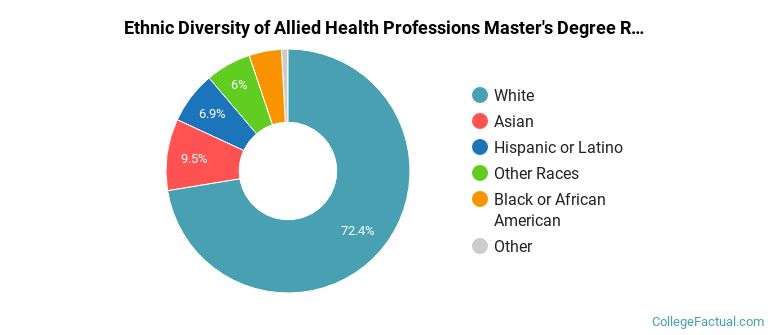
| Ethnic Background | Number of Students |
|---|---|
| Asian | 11 |
| Black or African American | 5 |
| Hispanic or Latino | 8 |
| White | 84 |
| Non-Resident Aliens | 1 |
| Other Races | 7 |
Take a look at the following statistics related to the make-up of the allied health majors at Medical University of South Carolina.
| Related Major | Annual Graduates |
|---|---|
| Nursing | 339 |
| Medicine | 153 |
| Rehabilitation & Therapeutic Professions | 120 |
| Health & Medical Administrative Services | 78 |
| Dentistry | 76 |
More about our data sources and methodologies.
