Here, you'll find out more about the major, including such details as the number of graduates, what degree levels are offered, ethnicity of students, and more. Also, learn how MUSC ranks among other schools offering degrees in health science.
Go directly to any of the following sections:
The bachelor's program at MUSC was ranked #62 on College Factual's Best Schools for health science list. It is also ranked #1 in South Carolina.
| Ranking Type | Rank |
|---|---|
| Best Health Sciences & Services Bachelor’s Degree Schools | 44 |
| Best Health Sciences & Services Schools | 62 |
During the 2021-2022 academic year, Medical University of South Carolina handed out 16 bachelor's degrees in health sciences & services. This is a decrease of 16% over the previous year when 19 degrees were handed out.
During the 2022-2023 academic year, part-time undergraduate students at MUSC paid an average of $1,440 per credit hour if they came to the school from out-of-state. In-state students paid a discounted rate of $686 per credit hour. The average full-time tuition and fees for undergraduates are shown in the table below.
| In State | Out of State | |
|---|---|---|
| Tuition | $15,622 | $29,030 |
| Fees | $1,350 | $1,350 |
Learn more about MUSC tuition and fees.
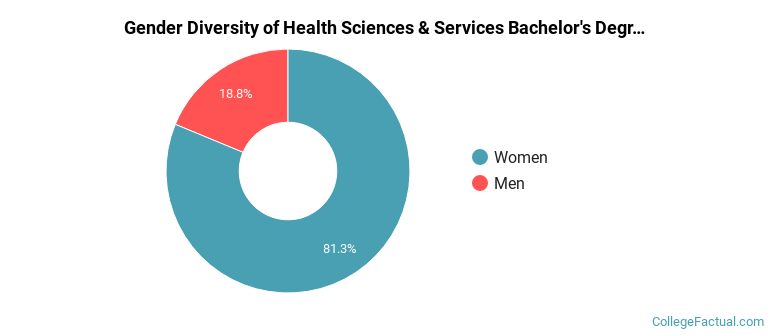
Of the 16 health science students who graduated with a bachelor's degree in 2021-2022 from MUSC, about 19% were men and 81% were women.
The majority of the students with this major are white. About 75% of 2022 graduates were in this category.
The following table and chart show the ethnic background for students who recently graduated from Medical University of South Carolina with a bachelor's in health science.
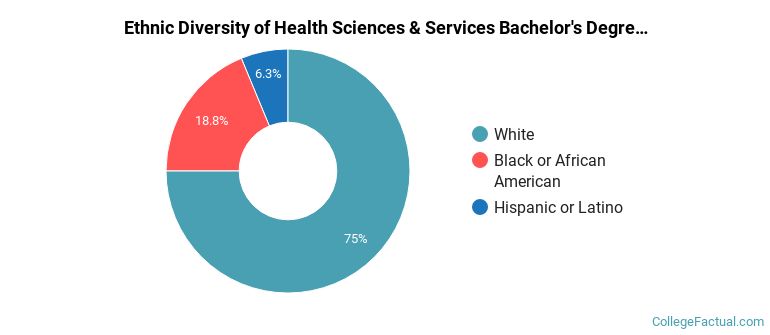
| Ethnic Background | Number of Students |
|---|---|
| Asian | 0 |
| Black or African American | 3 |
| Hispanic or Latino | 1 |
| White | 12 |
| Non-Resident Aliens | 0 |
| Other Races | 0 |
MUSC does not offer an online option for its health science bachelor’s degree program at this time. To see if the school offers distance learning options in other areas, visit the MUSC Online Learning page.
Take a look at the following statistics related to the make-up of the health science majors at Medical University of South Carolina.
| Related Major | Annual Graduates |
|---|---|
| Nursing | 339 |
| Medicine | 153 |
| Rehabilitation & Therapeutic Professions | 120 |
| Allied Health Professions | 116 |
| Health & Medical Administrative Services | 78 |
More about our data sources and methodologies.