Explore the best ranked schools for the programs you are most interested in.
According to College Factual's 2025 analysis, Merrimack is ranked #855 out of 2,152 schools in the nation that were analyzed for overall quality. This is an improvement over the previous year, when Merrimack held the #1,007 spot on the Best Overall Colleges list.
Merrimack is also ranked #44 out of 63 schools in Massachusetts.
When it comes to admittance, Merrimack College is somewhat selective. Its acceptance rate is 75%, which means you'll face some strong competition during the admissions process. Do what you can to make your application stand out.
The student to faculty ratio is often used to estimate how much interaction there is between professors and their students at a college or university. At Merrimack College, this ratio is 13 to 1, which is on par with the national average of 15 to 1. That's not bad at all.
When estimating how much access students will have to their teachers, some people like to look at what percentage of faculty members are full time. This is because part-time teachers may not have as much time to spend on campus as their full-time counterparts.
The full-time faculty percentage at Merrimack College is 46%. This is comparable to the national average of 47%.
Merrimack College has a freshmen retention rate of 82%. That's a good sign that full-time students like the school and their professors enough to want to stick around for another year. It's also a sign that the admissions team did a good job in choosing applicants who were a good fit for the school.
The on-time graduation rate for someone pursuing a bachelor's degree is typically four years. This rate at Merrimack for first-time, full-time students is 69%, which is better than the national average of 33.3%.
Find out more about the retention and graduation rates at Merrimack College.
During the 2017-2018 academic year, there were 4,202 undergraduates at Merrimack with 3,932 being full-time and 270 being part-time.
| $0-30 K | $30K-48K | $48-75 | $75-110K | $110K + |
|---|---|---|---|---|
| $26,132 | $28,586 | $34,604 | $34,545 | $39,754 |
The net price is calculated by adding tuition, room, board and other costs and subtracting financial aid.Note that the net price is typically less than the published for a school. For more information on the sticker price of Merrimack, see our tuition and fees and room and board pages.
While almost two-thirds of students nationwide take out loans to pay for college, the percentage may be quite different for the school you plan on attending. At Merrimack, approximately 64% of students took out student loans averaging $12,924 a year. That adds up to $51,696 over four years for those students.
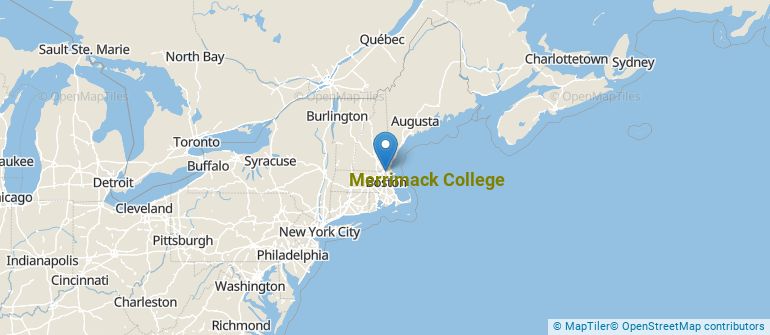
Get more details about the location of Merrimack College.
Contact details for Merrimack are given below.
| Contact Details | |
|---|---|
| Address: | 315 Turnpike St, North Andover, MA 01845 |
| Phone: | 978-837-5000 |
| Website: | https://www.merrimack.edu/ |
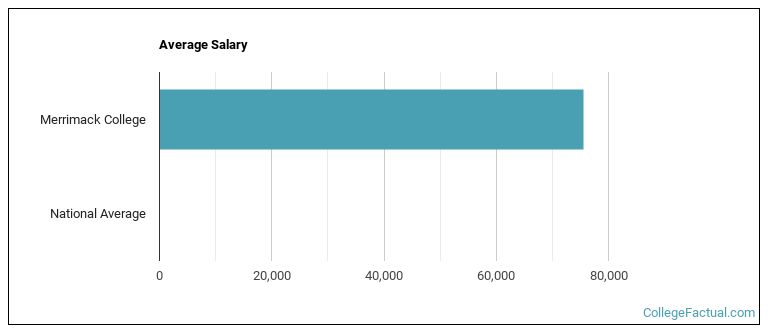
| Most Popular Majors | Bachelor’s Degrees | Average Salary of Graduates |
|---|---|---|
| Teacher Education Grade Specific | 138 | NA |
| Business Administration & Management | 123 | $48,018 |
| Human Development & Family Studies | 114 | $33,640 |
| Criminal Justice & Corrections | 103 | $43,323 |
| Accounting | 89 | NA |
| Health Sciences & Services | 82 | $31,161 |
| Marketing | 77 | NA |
| Curriculum & Instruction | 76 | NA |
| Finance & Financial Management | 74 | NA |
| Special Education | 71 | NA |
Online courses area a great option for busy, working students as well as for those who have scheduling conflicts and want to study on their own time. As time goes by, expect to see more and more online learning options become available.
In 2022-2023, 1,237 students took at least one online class at Merrimack College. This is a decrease from the 1,801 students who took online classes the previous year.
| Year | Took at Least One Online Class | Took All Classes Online |
|---|---|---|
| 2022-2023 | 1,237 | 812 |
| 2021-2022 | 1,801 | 878 |
| 2020-2021 | 4,238 | 545 |
| 2018-2019 | 352 | 265 |
Footnotes
*The racial-ethnic minorities count is calculated by taking the total number of students and subtracting white students, international students, and students whose race/ethnicity was unknown. This number is then divided by the total number of students at the school to obtain the racial-ethnic minorities percentage.
References
More about our data sources and methodologies.