
In its yearly rankings, College Factual analyzes over 2,000 colleges and universities to determine which ones are the best in a variety of categories, such as overall value, quality, diversity, which schools are the best for each major, and much more.
Mesa Community College was awarded 26 badges in the 2025 rankings. The highest ranked major at the school is business administration & management.
Explore the best ranked schools for the programs you are most interested in.
Mesa Community College landed the #643 spot in College Factual's 2025 ranking of best overall colleges in the United States. The higher ed experts analyzed 2,152 colleges and universities across the nation to determine this ranking.
Mesa Community College also holds the #12 spot on the Best Colleges in Arizona ranking.
If you are worried about getting into Mesa Community College, don't be. The school has a liberal open admissions policy, which means you only need to meet basic requirements in order to be admitted. Still, be sure to submit a complete application and provide any other requested materials.
With a student to faculty ratio of 15 to 1, Mesa Community College is about average in this regard as the nationwide rate is 15 to 1. While this does not translate directly to class size, it's a good indicator of how much time professors will have to spend with their students on a one-on-one basis.
When estimating how much access students will have to their teachers, some people like to look at what percentage of faculty members are full time. This is because part-time teachers may not have as much time to spend on campus as their full-time counterparts.
The full-time faculty percentage at Mesa Community College is 100%. This is higher than the national average of 47%.
The freshmen retention rate tells us what percentage of first-year, full-time students choose to continue on to their sophomore year at a particular school. The rate at Mesa Community College is 64%, which is about average when compared to the national rate of 68%.
During the 2017-2018 academic year, there were 16,948 undergraduates at Mesa Community College with 4,975 being full-time and 11,973 being part-time.
| $0-30 K | $30K-48K | $48-75 | $75-110K | $110K + |
|---|---|---|---|---|
| $11,062 | $11,758 | $13,346 | $15,329 | $17,056 |
The net price is calculated by adding tuition, room, board and other costs and subtracting financial aid.Note that the net price is typically less than the published for a school. For more information on the sticker price of Mesa Community College, see our tuition and fees and room and board pages.
While almost two-thirds of students nationwide take out loans to pay for college, the percentage may be quite different for the school you plan on attending. At Mesa Community College, approximately 9% of students took out student loans averaging $3,750 a year. That adds up to $15,000 over four years for those students.
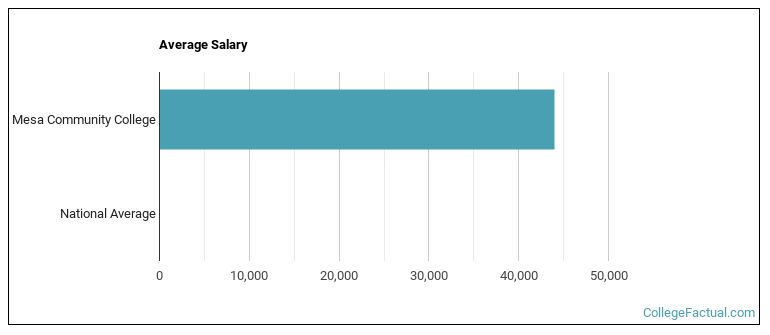
See which majors at Mesa Community College make the most money.
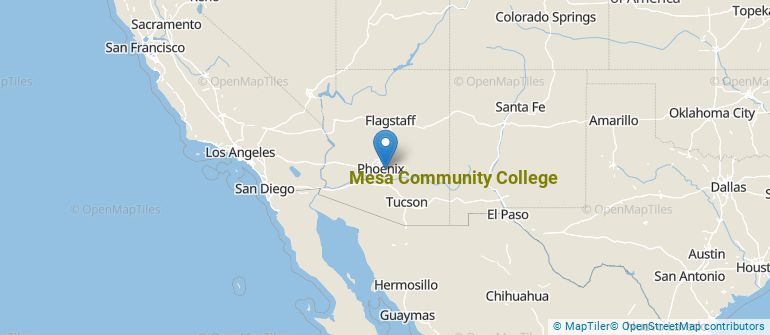
Get more details about the location of Mesa Community College.
Contact details for Mesa Community College are given below.
| Contact Details | |
|---|---|
| Address: | 1833 W Southern Ave, Mesa, AZ 85202 |
| Phone: | 480-461-7000 |
| Website: | www.mesacc.edu/ |
| Most Popular Majors | Bachelor’s Degrees | Average Salary of Graduates |
|---|---|---|
| Fine & Studio Arts | 924 | NA |
| Liberal Arts General Studies | 705 | NA |
| Nursing | 228 | NA |
| Business Administration & Management | 210 | NA |
| General Business/Commerce | 202 | NA |
| Practical Nursing & Nursing Assistants | 192 | NA |
| Natural Sciences | 152 | NA |
| General Physical Sciences | 102 | NA |
| Vehicle Maintenance & Repair | 100 | NA |
| Allied Health Professions | 92 | NA |
Online courses area a great option for busy, working students as well as for those who have scheduling conflicts and want to study on their own time. As time goes by, expect to see more and more online learning options become available.
In 2022-2023, 8,358 students took at least one online class at Mesa Community College. This is a decrease from the 9,803 students who took online classes the previous year.
| Year | Took at Least One Online Class | Took All Classes Online |
|---|---|---|
| 2022-2023 | 8,358 | 3,977 |
| 2021-2022 | 9,803 | 4,709 |
| 2020-2021 | 12,040 | 5,895 |
| 2018-2019 | 7,123 | 2,903 |
Footnotes
*The racial-ethnic minorities count is calculated by taking the total number of students and subtracting white students, international students, and students whose race/ethnicity was unknown. This number is then divided by the total number of students at the school to obtain the racial-ethnic minorities percentage.
References
More about our data sources and methodologies.