Colorado Mesa total enrollment is approximately 9,110 students. 6,857 are undergraduates and 70 are graduate students.
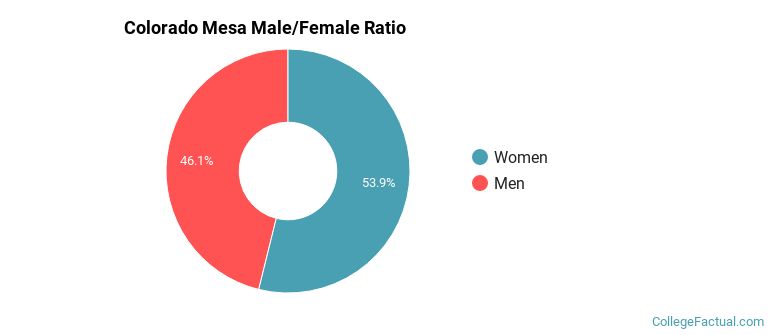
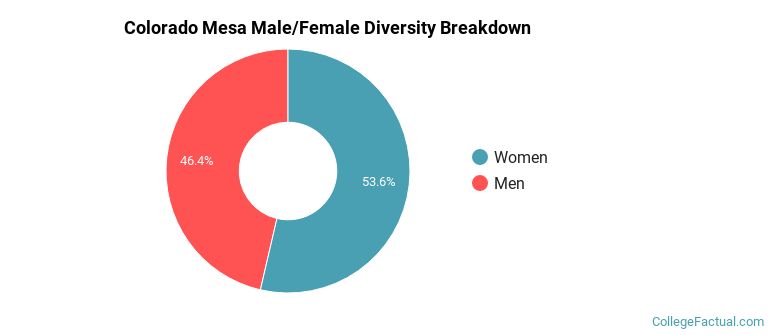
Male/Female Breakdown of Undergraduates
The full-time Colorado Mesa undergraduate population is made up of 54% women, and 46% men.
For the gender breakdown for all students, go here.
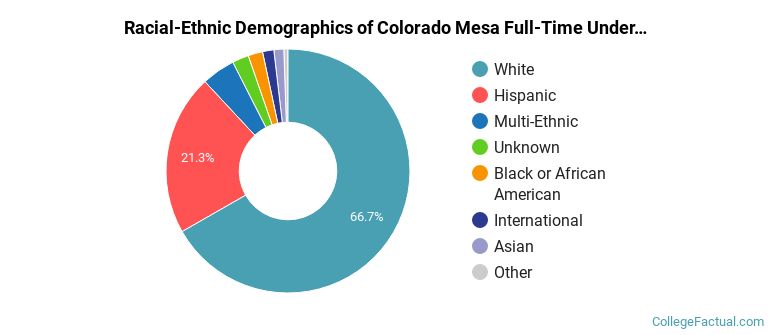
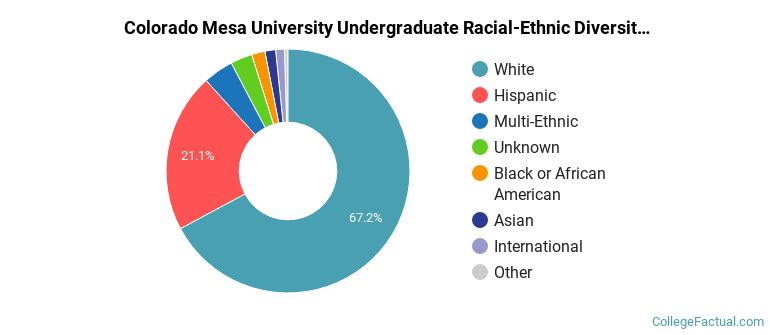
Colorado Mesa Racial/Ethnic Breakdown of Undergraduates
| Race/Ethnicity | Number |
|---|---|
| White | 4,488 |
| Hispanic | 1,484 |
| Multi-Ethnic | 312 |
| Black or African American | 154 |
| Unknown | 148 |
| Asian | 108 |
| International | 87 |
| Native Hawaiian or Pacific Islander | 39 |
See racial/ethnic breakdown for all students.
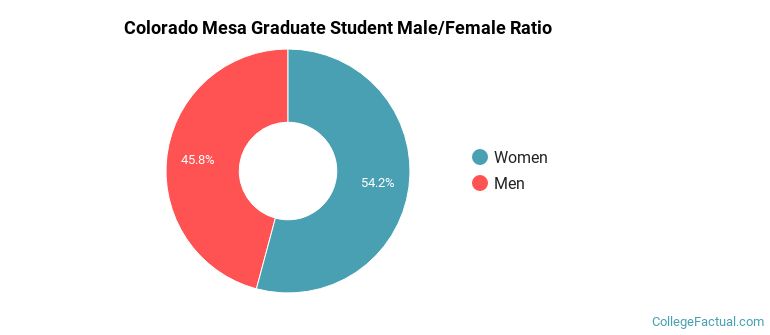
Male/Female Breakdown of Graduate Students
About 67% of full-time grad students are women, and 33% men.
For the gender breakdown for all students, go here.
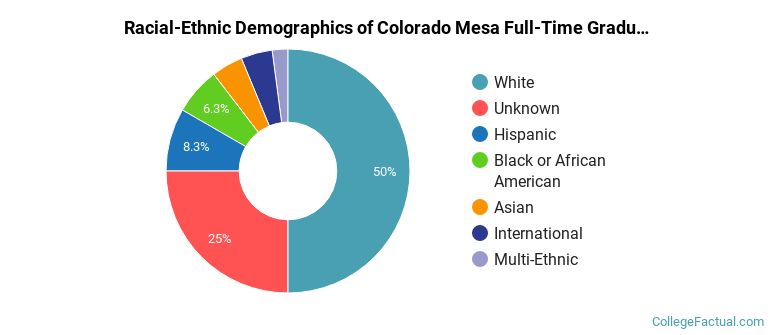
Colorado Mesa Racial-Ethnic Breakdown of Graduate Students
| Race/Ethnicity | Number |
|---|---|
| White | 45 |
| Unknown | 20 |
| Hispanic | 4 |
| Multi-Ethnic | 1 |
| Asian | 0 |
| Black or African American | 0 |
| Native Hawaiian or Pacific Islander | 0 |
| International | 0 |
See racial/ethnic breakdown for all students.
| Race/Ethnicity | Number |
|---|---|
| White | 6,045 |
| Hispanic | 1,893 |
| Multi-Ethnic | 392 |
| Unknown | 275 |
| Black or African American | 183 |
| Asian | 135 |
| International | 92 |
| Native Hawaiian or Pacific Islander | 45 |
There are approximately 4,957 female students and 4,153 male students at Colorado Mesa.
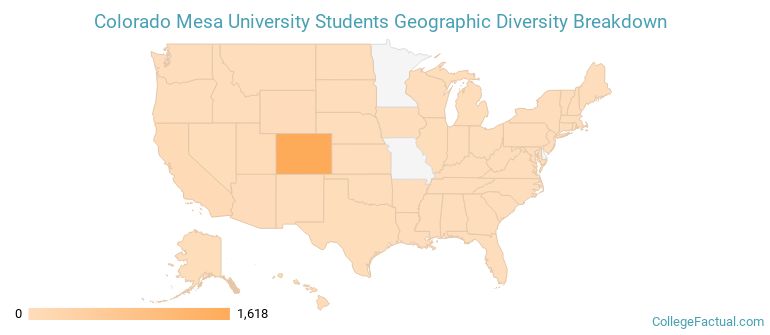
Colorado Mesa ranks 549 out of 2,183 when it comes to geographic diversity.
18.84% of Colorado Mesa students come from out of state, and 1.29% come from out of the country.
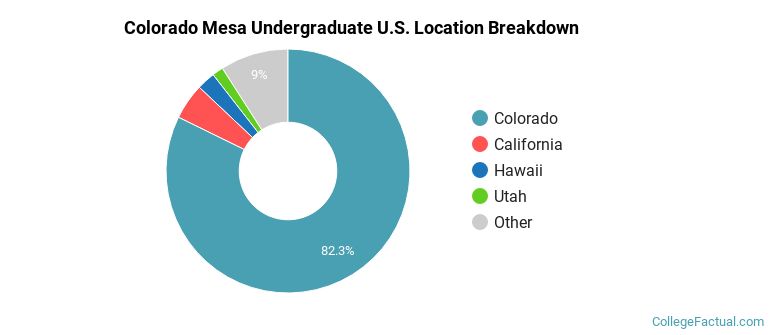
The undergraduate student body is split among 38 states (may include Washington D.C.). Click on the map for more detail.
| State | Amount |
|---|---|
| Colorado | 1,618 |
| California | 94 |
| Hawaii | 48 |
| Utah | 29 |
| Arizona | 19 |
Students from 35 countries are represented at this school, with the majority of the international students coming from Nigeria, Canada, and Nepal.
Learn more about international students at Colorado Mesa.
A traditional college student is defined as being between the ages of 18-21. At Colorado Mesa, 55.44% of students fall into that category, compared to the national average of 60%.
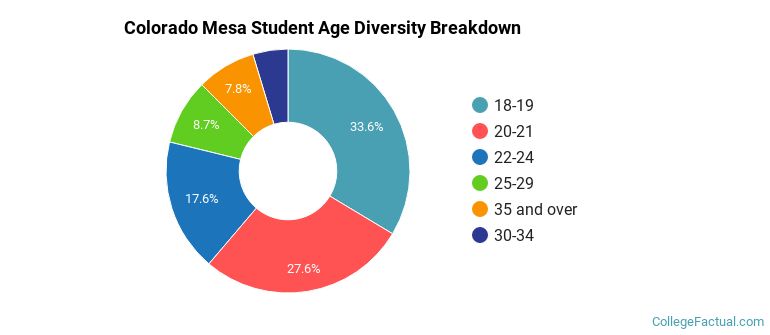
| Student Age Group | Amount |
|---|---|
| 18-19 | 2,918 |
| 20-21 | 2,399 |
| 22-24 | 1,528 |
| 25-29 | 754 |
| 35 and over | 681 |
| 30-34 | 404 |
| Under 18 | 0 |
Footnotes
*The racial-ethnic minorities count is calculated by taking the total number of students and subtracting white students, international students, and students whose race/ethnicity was unknown. This number is then divided by the total number of students at the school to obtain the racial-ethnic minorities percentage.
References
Department of Homeland Security Citizenship and Immigration Services
Image Credit: By Cygnusloop99 under License
Learn more about how College Factual creates their Diversity Rankings.