Messiah total enrollment is approximately 3,370 students. 2,424 are undergraduates and 290 are graduate students.
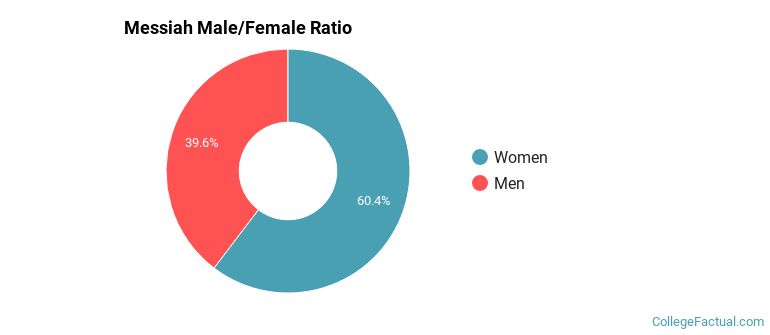
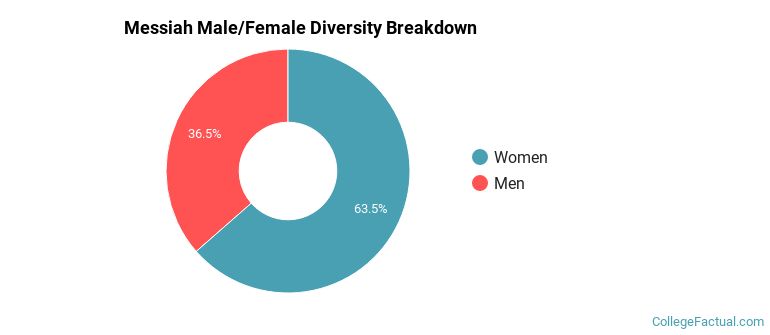
Male/Female Breakdown of Undergraduates
The full-time Messiah undergraduate population is made up of 60% women, and 40% men.
For the gender breakdown for all students, go here.
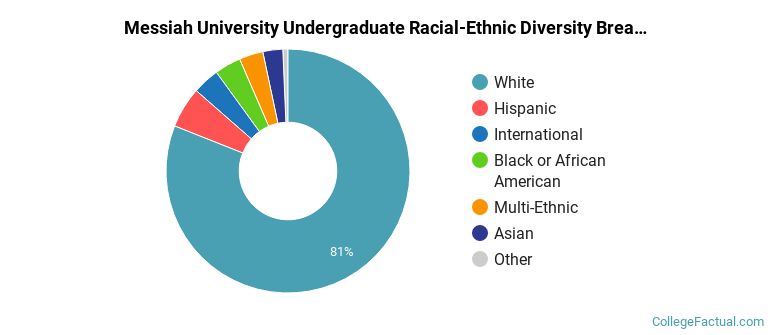
Messiah Racial/Ethnic Breakdown of Undergraduates

| Race/Ethnicity | Number |
|---|---|
| White | 1,963 |
| Hispanic | 141 |
| Black or African American | 82 |
| Multi-Ethnic | 81 |
| International | 78 |
| Asian | 68 |
| Unknown | 7 |
| Native Hawaiian or Pacific Islander | 1 |
See racial/ethnic breakdown for all students.
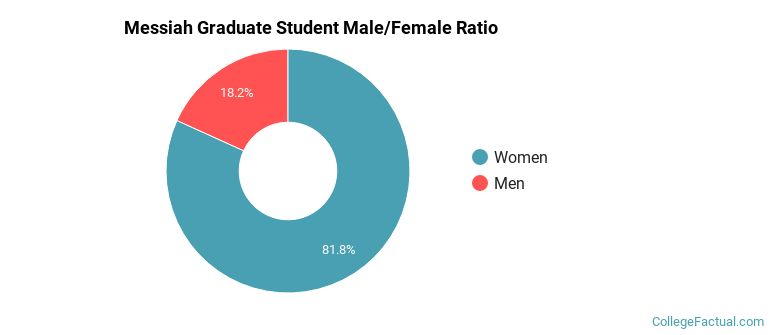
Male/Female Breakdown of Graduate Students
About 75% of full-time grad students are women, and 25% men.
For the gender breakdown for all students, go here.
Messiah Racial-Ethnic Breakdown of Graduate Students
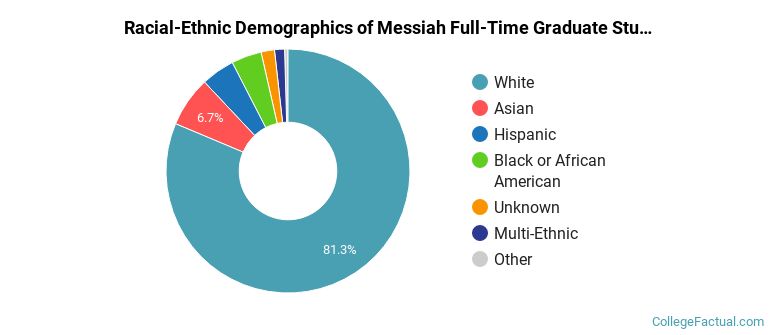
| Race/Ethnicity | Number |
|---|---|
| White | 223 |
| Asian | 22 |
| Black or African American | 19 |
| Hispanic | 14 |
| Multi-Ethnic | 7 |
| International | 4 |
| Unknown | 1 |
| Native Hawaiian or Pacific Islander | 0 |
See racial/ethnic breakdown for all students.
| Race/Ethnicity | Number |
|---|---|
| White | 2,710 |
| Hispanic | 192 |
| Black or African American | 140 |
| Multi-Ethnic | 108 |
| Asian | 103 |
| International | 94 |
| Unknown | 19 |
| Native Hawaiian or Pacific Islander | 1 |
There are approximately 2,106 female students and 1,264 male students at Messiah.
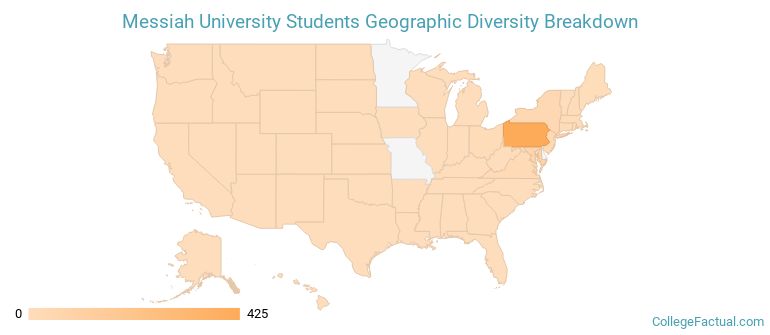
Messiah ranks 701 out of 2,183 when it comes to geographic diversity.
35.15% of Messiah students come from out of state, and 3.65% come from out of the country.
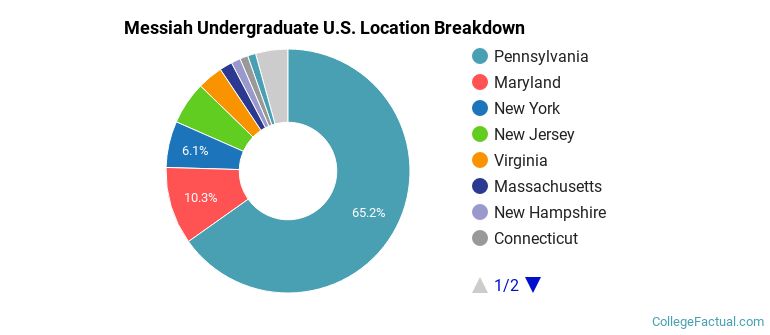
The undergraduate student body is split among 26 states (may include Washington D.C.). Click on the map for more detail.
| State | Amount |
|---|---|
| Pennsylvania | 425 |
| Maryland | 67 |
| New York | 40 |
| New Jersey | 37 |
| Virginia | 22 |
Students from 32 countries are represented at this school, with the majority of the international students coming from Malaysia, China, and Vietnam.
Learn more about international students at Messiah.
A traditional college student is defined as being between the ages of 18-21. At Messiah, 72.92% of students fall into that category, compared to the national average of 60%.
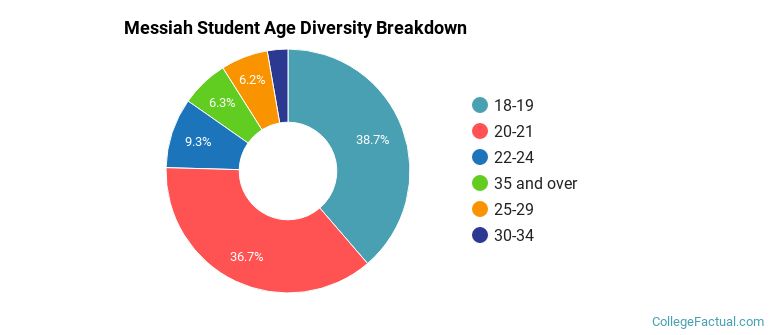
| Student Age Group | Amount |
|---|---|
| 18-19 | 1,246 |
| 20-21 | 1,183 |
| 22-24 | 299 |
| 35 and over | 203 |
| 25-29 | 201 |
| 30-34 | 88 |
| Under 18 | 0 |
Footnotes
*The racial-ethnic minorities count is calculated by taking the total number of students and subtracting white students, international students, and students whose race/ethnicity was unknown. This number is then divided by the total number of students at the school to obtain the racial-ethnic minorities percentage.
References