Explore the best ranked schools for the programs you are most interested in.
MTSO was not ranked in College Factual's Best Overall Colleges report this year. This may be because not enough data was available.
See all of the rankings for Methodist Theological School in Ohio.
Data for the student to faculty ratio for this school has not been reported.
In addition to the student to faculty ratio, some people look at what percentage of faculty members are full-time as a sign of how much time professors will be able to spend with their students. This is because part-time teachers may not be be on campus as much as their full-time counterparts.
The full-time faculty percentage at Methodist Theological School in Ohio is 71%. This is higher than the national average of 47%.
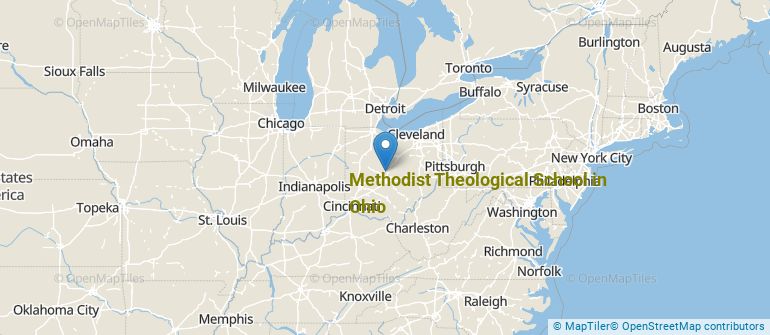
Get more details about the location of Methodist Theological School in Ohio.
Contact details for MTSO are given below.
| Contact Details | |
|---|---|
| Address: | 3081 Columbus Pike, Delaware, OH 43015-3211 |
| Phone: | 740-363-1146 |
| Website: | https://www.mtso.edu/ |
| Most Popular Majors | Bachelor’s Degrees | Average Salary of Graduates |
|---|---|---|
| Theological & Ministerial Studies | 16 | NA |
| Theology & Religious Vocations (Other) | 8 | NA |
| Pastoral Counseling & Specialized Ministries | 1 | NA |
| Religious Studies | 0 | NA |
Online learning options are becoming more and more popular at American colleges and universities. Online classes are great for students who have busy schedules or for those who just want to study on their own time.
In 2022-2023, 124 students took at least one online class at Methodist Theological School in Ohio. This is an increase from the 119 students who took online classes the previous year.
| Year | Took at Least One Online Class | Took All Classes Online |
|---|---|---|
| 2022-2023 | 124 | 91 |
| 2021-2022 | 119 | 104 |
| 2020-2021 | 110 | 56 |
| 2018-2019 | 7 | 0 |
Learn more about online learning at Methodist Theological School in Ohio.
Footnotes
*The racial-ethnic minorities count is calculated by taking the total number of students and subtracting white students, international students, and students whose race/ethnicity was unknown. This number is then divided by the total number of students at the school to obtain the racial-ethnic minorities percentage.
References
More about our data sources and methodologies.