MSU Denver total enrollment is approximately 19,086 students. 11,134 are undergraduates and 614 are graduate students.
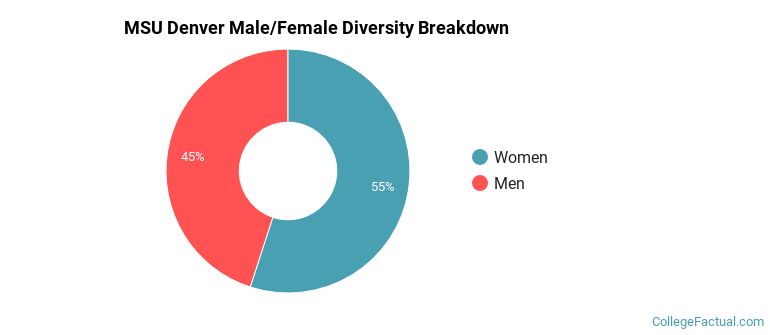
Male/Female Breakdown of Undergraduates
The full-time MSU Denver undergraduate population is made up of 55% women, and 45% men.

For the gender breakdown for all students, go here.
MSU Denver Racial/Ethnic Breakdown of Undergraduates

| Race/Ethnicity | Number |
|---|---|
| White | 5,406 |
| Hispanic | 3,609 |
| Black or African American | 693 |
| Multi-Ethnic | 581 |
| Asian | 490 |
| Unknown | 180 |
| International | 101 |
| Native Hawaiian or Pacific Islander | 24 |
See racial/ethnic breakdown for all students.
Male/Female Breakdown of Graduate Students
About 82% of full-time grad students are women, and 18% men.

For the gender breakdown for all students, go here.
MSU Denver Racial-Ethnic Breakdown of Graduate Students

| Race/Ethnicity | Number |
|---|---|
| White | 410 |
| Hispanic | 125 |
| Multi-Ethnic | 26 |
| Black or African American | 24 |
| Asian | 14 |
| Unknown | 6 |
| International | 4 |
| Native Hawaiian or Pacific Islander | 2 |
See racial/ethnic breakdown for all students.

| Race/Ethnicity | Number |
|---|---|
| White | 9,503 |
| Hispanic | 5,967 |
| Black or African American | 1,241 |
| Multi-Ethnic | 953 |
| Asian | 814 |
| Unknown | 345 |
| International | 133 |
| Native Hawaiian or Pacific Islander | 35 |
There are approximately 10,846 female students and 8,240 male students at MSU Denver.
MSU Denver ranks 1,495 out of 2,183 when it comes to geographic diversity.
3.15% of MSU Denver students come from out of state, and 0% come from out of the country.
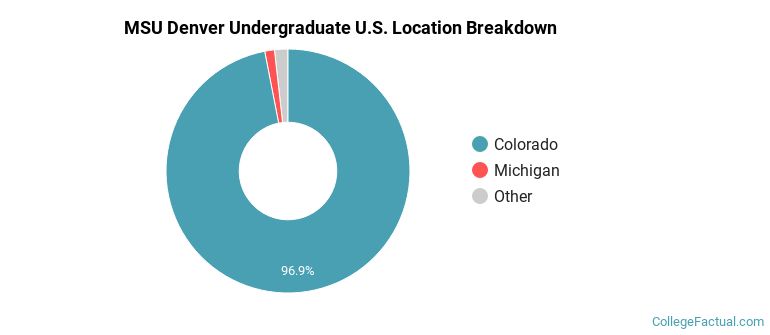
The undergraduate student body is split among 18 states (may include Washington D.C.). Click on the map for more detail.

| State | Amount |
|---|---|
| Colorado | 2,184 |
| Michigan | 29 |
| California | 10 |
| Texas | 6 |
| New Mexico | 5 |
Students from 66 countries are represented at this school, with the majority of the international students coming from Vietnam, China, and India.
Learn more about international students at MSU Denver.
A traditional college student is defined as being between the ages of 18-21. At MSU Denver, 36.06% of students fall into that category, compared to the national average of 60%.

| Student Age Group | Amount |
|---|---|
| 22-24 | 4,431 |
| 25-29 | 4,176 |
| 18-19 | 3,681 |
| 20-21 | 3,640 |
| 35 and over | 2,235 |
| 30-34 | 1,914 |
| Under 18 | 0 |
Footnotes
*The racial-ethnic minorities count is calculated by taking the total number of students and subtracting white students, international students, and students whose race/ethnicity was unknown. This number is then divided by the total number of students at the school to obtain the racial-ethnic minorities percentage.
References
Department of Homeland Security Citizenship and Immigration Services
Image Credit: By Jeffrey Beall under License
Learn more about how College Factual creates their Diversity Rankings.