Go directly to any of the following sections:
The bachelor's program at MSU Moorhead was ranked #86 on College Factual's Best Schools for legal professions list.
| Ranking Type | Rank |
|---|---|
| Best Legal Professions Schools | 86 |
During the 2021-2022 academic year, Minnesota State University - Moorhead handed out 9 bachelor's degrees in legal professions. This is a decrease of 50% over the previous year when 18 degrees were handed out.
In 2022-2023, the average part-time undergraduate tuition at MSU Moorhead was $295 per credit hour for both in-state and out-of-state students. The average full-time tuition and fees for undergraduates are shown in the table below.
| In State | Out of State | |
|---|---|---|
| Tuition | $8,838 | $8,838 |
| Fees | $1,498 | $1,498 |
| Books and Supplies | $1,000 | $1,000 |
| On Campus Room and Board | $10,594 | $10,594 |
| On Campus Other Expenses | $3,770 | $3,770 |
Learn more about MSU Moorhead tuition and fees.
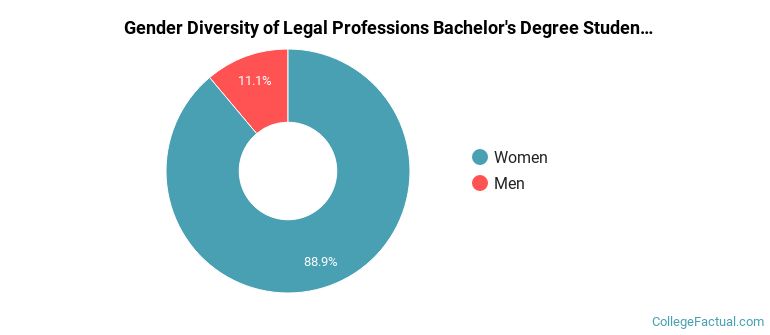
Of the 9 students who earned a bachelor's degree in Legal Professions from MSU Moorhead in 2021-2022, 11% were men and 89% were women.
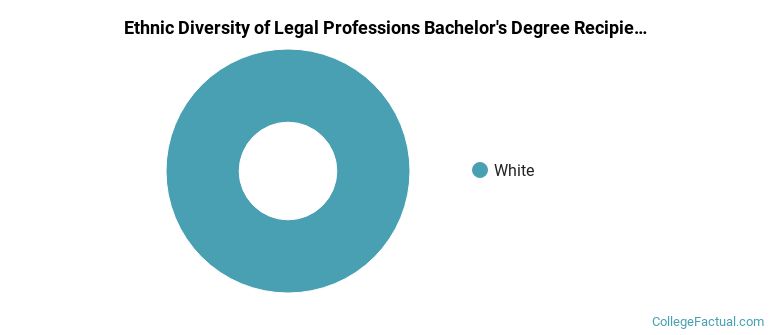
The majority of the students with this major are white. About 100% of 2022 graduates were in this category.
The following table and chart show the ethnic background for students who recently graduated from Minnesota State University - Moorhead with a bachelor's in legal professions.
| Ethnic Background | Number of Students |
|---|---|
| Asian | 0 |
| Black or African American | 0 |
| Hispanic or Latino | 0 |
| White | 9 |
| Non-Resident Aliens | 0 |
| Other Races | 0 |
Online degrees for the MSU Moorhead legal professions bachelor’s degree program are not available at this time. To see if the school offers distance learning options in other areas, visit the MSU Moorhead Online Learning page.
Take a look at the following statistics related to the make-up of the legal professions majors at Minnesota State University - Moorhead.
Legal Professions students may decide to major in one of the following focus areas. Individual majors may not be available for all degree levels.
| Major | Annual Graduates |
|---|---|
| Legal Support Services | 9 |
| Related Major | Annual Graduates |
|---|---|
| Homeland Security, Law Enforcement & Firefighting | 42 |
More about our data sources and methodologies.