Misericordia University total enrollment is approximately 2,374 students. 1,473 are undergraduates and 321 are graduate students.
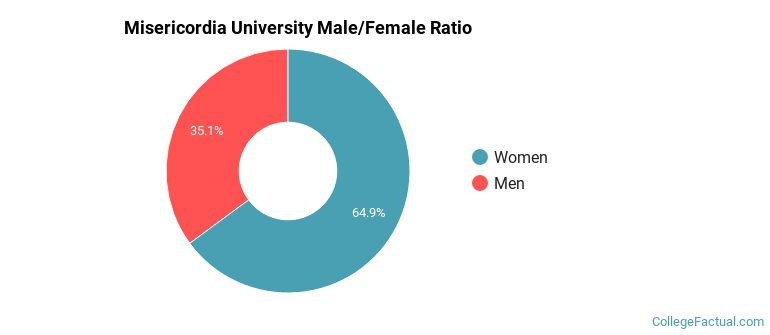
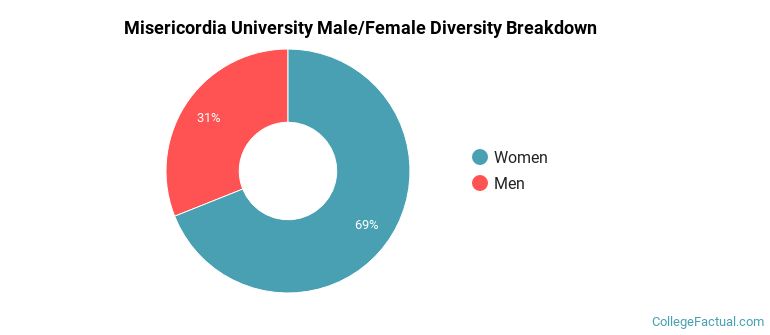
Male/Female Breakdown of Undergraduates
The full-time Misericordia University undergraduate population is made up of 65% women, and 35% men.
For the gender breakdown for all students, go here.
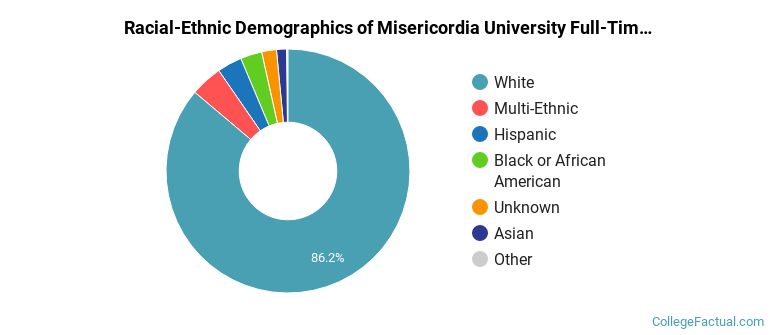
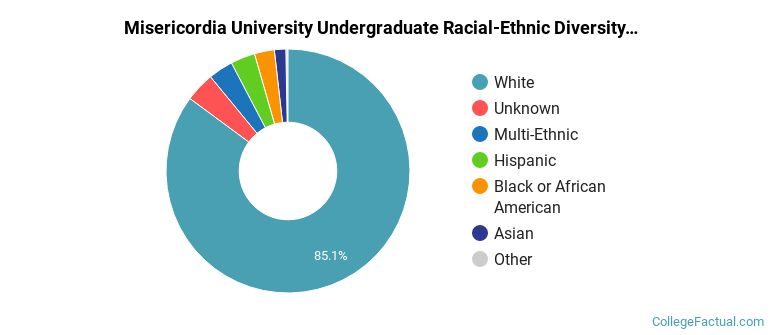
Misericordia University Racial/Ethnic Breakdown of Undergraduates
| Race/Ethnicity | Number |
|---|---|
| White | 1,278 |
| Multi-Ethnic | 64 |
| Hispanic | 46 |
| Black or African American | 36 |
| Unknown | 26 |
| Asian | 19 |
| International | 2 |
| Native Hawaiian or Pacific Islander | 0 |
See racial/ethnic breakdown for all students.
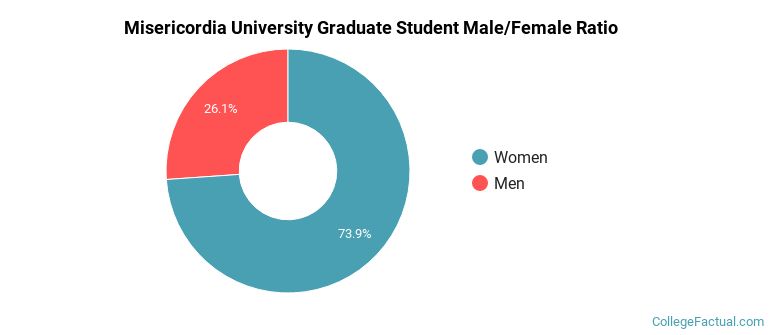
Male/Female Breakdown of Graduate Students
About 74% of full-time grad students are women, and 26% men.
For the gender breakdown for all students, go here.
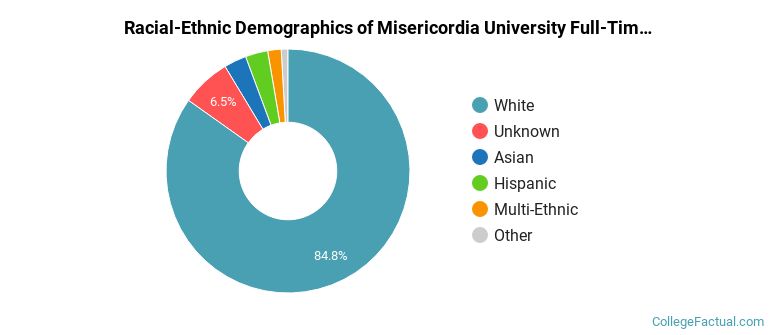
Misericordia University Racial-Ethnic Breakdown of Graduate Students
| Race/Ethnicity | Number |
|---|---|
| White | 275 |
| Unknown | 13 |
| Asian | 11 |
| Multi-Ethnic | 10 |
| Hispanic | 8 |
| Black or African American | 4 |
| Native Hawaiian or Pacific Islander | 0 |
| International | 0 |
See racial/ethnic breakdown for all students.
| Race/Ethnicity | Number |
|---|---|
| White | 2,012 |
| Multi-Ethnic | 87 |
| Hispanic | 80 |
| Unknown | 74 |
| Black or African American | 66 |
| Asian | 45 |
| International | 3 |
| Native Hawaiian or Pacific Islander | 2 |
There are approximately 1,652 female students and 722 male students at Misericordia University.
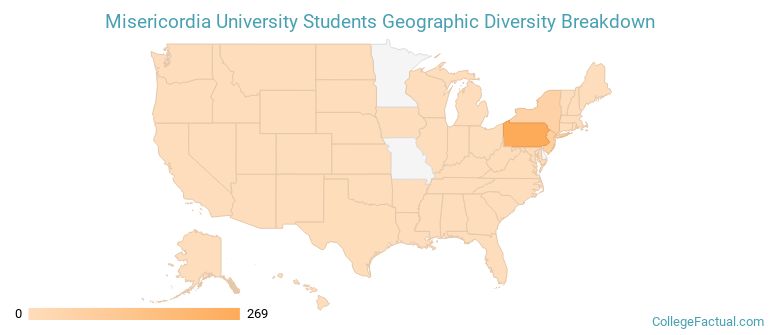
Misericordia University ranks 1,078 out of 2,183 when it comes to geographic diversity.
37.44% of Misericordia University students come from out of state, and 0% come from out of the country.
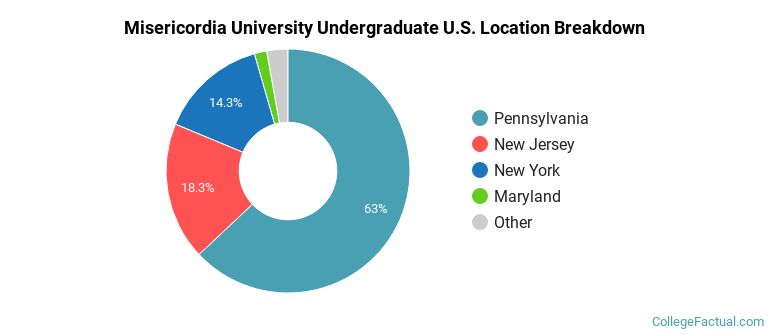
The undergraduate student body is split among 13 states (may include Washington D.C.). Click on the map for more detail.
| State | Amount |
|---|---|
| Pennsylvania | 269 |
| New Jersey | 78 |
| New York | 61 |
| Maryland | 7 |
| Connecticut | 2 |
There are international students present from Saudi Arabia.
Learn more about international students at Misericordia University.
A traditional college student is defined as being between the ages of 18-21. At Misericordia University, 55.87% of students fall into that category, compared to the national average of 60%.
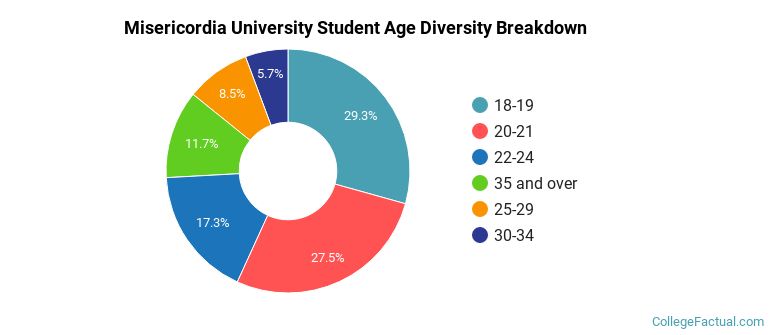
| Student Age Group | Amount |
|---|---|
| 18-19 | 781 |
| 20-21 | 732 |
| 22-24 | 461 |
| 35 and over | 311 |
| 25-29 | 227 |
| 30-34 | 151 |
| Under 18 | 0 |
Footnotes
*The racial-ethnic minorities count is calculated by taking the total number of students and subtracting white students, international students, and students whose race/ethnicity was unknown. This number is then divided by the total number of students at the school to obtain the racial-ethnic minorities percentage.
References
Department of Homeland Security Citizenship and Immigration Services
Image Credit: By Mike Russell under License
Learn more about how College Factual creates their Diversity Rankings.