We've gathered data and other essential information about the program, such as the average salary of graduates, ethnicity of students, how many students graduated in recent times, and more. In addition, we cover how Mississippi State ranks in comparison to other schools with biology programs.
Jump to any of the following sections:
The bachelor's program at Mississippi State was ranked #179 on College Factual's Best Schools for biology list. It is also ranked #1 in Mississippi.
| Ranking Type | Rank |
|---|---|
| Best General Biology Master’s Degree Schools | 51 |
| Best General Biology Graduate Degree Schools | 74 |
| Best General Biology Schools | 179 |
| Best General Biology Bachelor’s Degree Schools | 184 |
During the 2021-2022 academic year, Mississippi State University handed out 147 bachelor's degrees in general biology. This is a decrease of 5% over the previous year when 155 degrees were handed out.
In 2022, 20 students received their master’s degree in biology from Mississippi State. This makes it the #80 most popular school for biology master’s degree candidates in the country.
In addition, 7 students received their doctoral degrees in biology in 2022, making the school the #66 most popular school in the United States for this category of students.
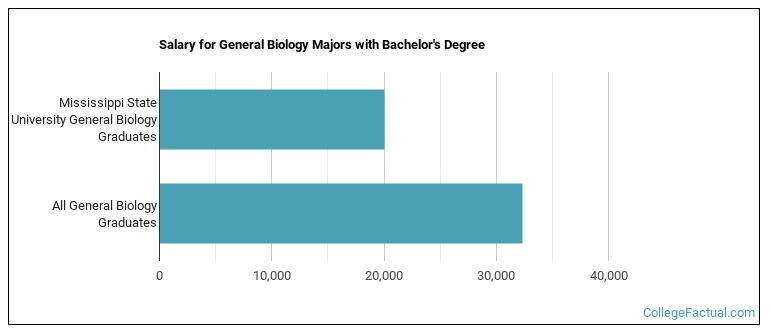
Biology majors who earn their bachelor's degree from Mississippi State go on to jobs where they make a median salary of $20,056 a year. This is less than $32,337, which is the national median of all biology majors in the nation who earn bachelor's degrees.
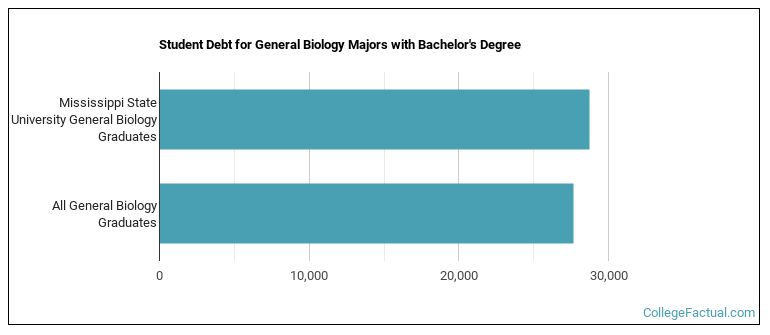
While getting their bachelor's degree at Mississippi State, biology students borrow a median amount of $28,752 in student loans. This is higher than the the typical median of $27,650 for all biology majors across the country.
The typical student loan payment of a bachelor's degree student from the biology program at Mississippi State is $189 per month.
In 2022-2023, the average part-time undergraduate tuition at Mississippi State was $1,102 per credit hour for out-of-state students. The average for in-state students was $403 per credit hour. Information about average full-time undergraduate tuition and fees is shown in the table below.
| In State | Out of State | |
|---|---|---|
| Tuition | $9,665 | $26,430 |
| Fees | $150 | $150 |
| Books and Supplies | $1,200 | $1,200 |
| On Campus Room and Board | $12,293 | $12,293 |
| On Campus Other Expenses | $6,146 | $6,146 |
Learn more about Mississippi State tuition and fees.
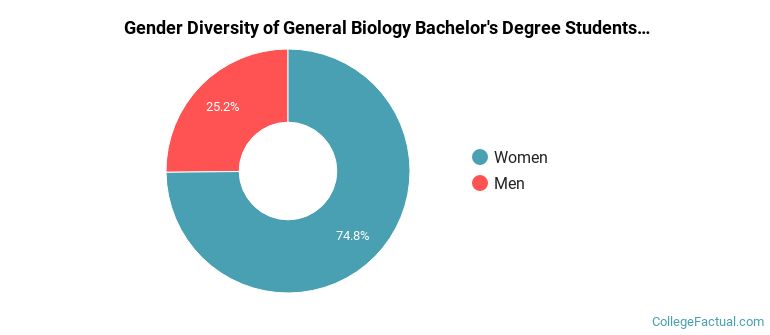
The biology program at Mississippi State awarded 147 bachelor's degrees in 2021-2022. About 25% of these degrees went to men with the other 75% going to women.
The majority of the students with this major are white. About 76% of 2022 graduates were in this category.
The following table and chart show the ethnic background for students who recently graduated from Mississippi State University with a bachelor's in biology.
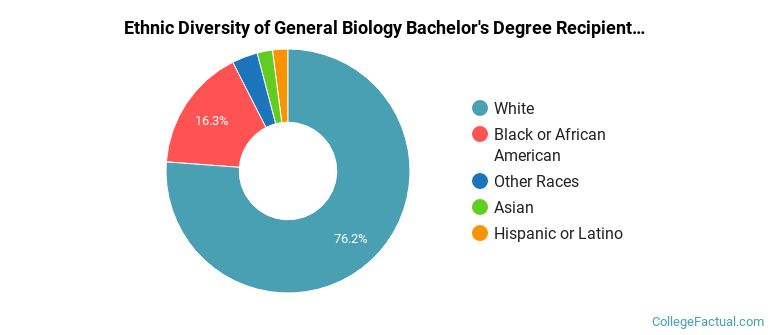
| Ethnic Background | Number of Students |
|---|---|
| Asian | 3 |
| Black or African American | 24 |
| Hispanic or Latino | 3 |
| White | 112 |
| Non-Resident Aliens | 0 |
| Other Races | 5 |
Online degrees for the Mississippi State biology bachelor’s degree program are not available at this time. To see if the school offers distance learning options in other areas, visit the Mississippi State Online Learning page.
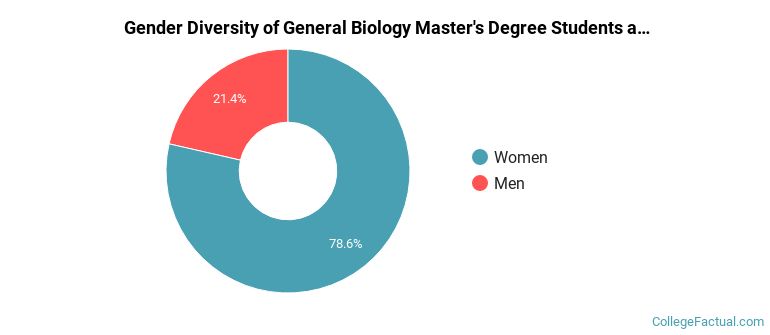
Of the 14 students who earned a master's degree in General Biology from Mississippi State in 2021-2022, 21% were men and 79% were women.
The majority of master's degree recipients in this major at Mississippi State are white. In the most recent graduating class for which data is available, 71% of students fell into this category.
The following table and chart show the ethnic background for students who recently graduated from Mississippi State University with a master's in biology.
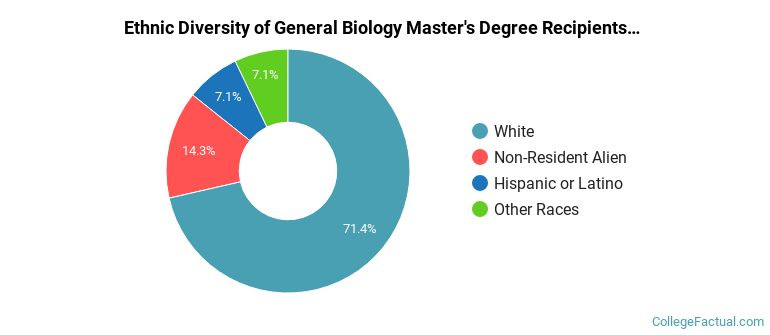
| Ethnic Background | Number of Students |
|---|---|
| Asian | 0 |
| Black or African American | 0 |
| Hispanic or Latino | 1 |
| White | 10 |
| Non-Resident Aliens | 2 |
| Other Races | 1 |
Take a look at the following statistics related to the make-up of the biology majors at Mississippi State University.
| Related Major | Annual Graduates |
|---|---|
| Biochemistry, Biophysics & Molecular Biology | 104 |
| Microbiological Sciences & Immunology | 55 |
| Botany/Plant Biology | 23 |
| Zoology | 12 |
| Biomathematics & Bioinformatics | 1 |