Monmouth total enrollment is approximately 5,674 students. 4,093 are undergraduates and 607 are graduate students.
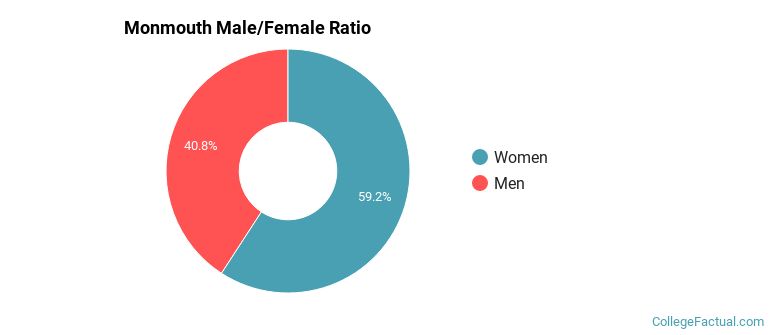
Male/Female Breakdown of Undergraduates
The full-time Monmouth undergraduate population is made up of 61% women, and 39% men.
For the gender breakdown for all students, go here.
Monmouth Racial/Ethnic Breakdown of Undergraduates
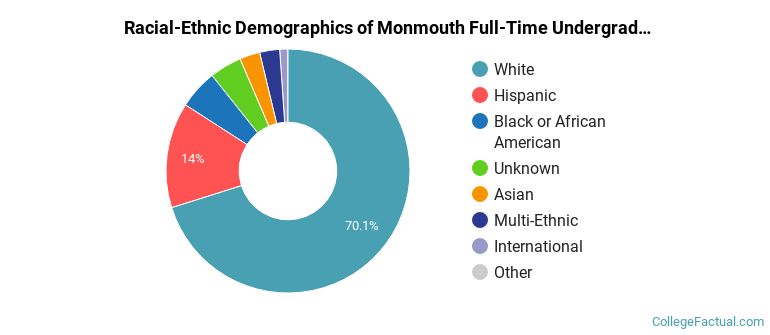
| Race/Ethnicity | Number |
|---|---|
| White | 2,827 |
| Hispanic | 632 |
| Black or African American | 207 |
| Unknown | 154 |
| Multi-Ethnic | 109 |
| Asian | 102 |
| International | 57 |
| Native Hawaiian or Pacific Islander | 2 |
See racial/ethnic breakdown for all students.
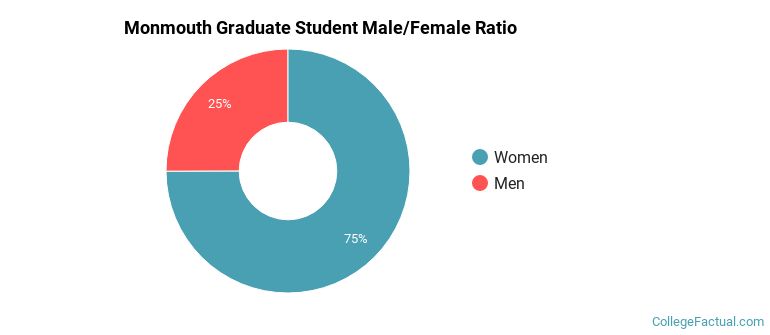
Male/Female Breakdown of Graduate Students
About 72% of full-time grad students are women, and 28% men.
For the gender breakdown for all students, go here.
Monmouth Racial-Ethnic Breakdown of Graduate Students
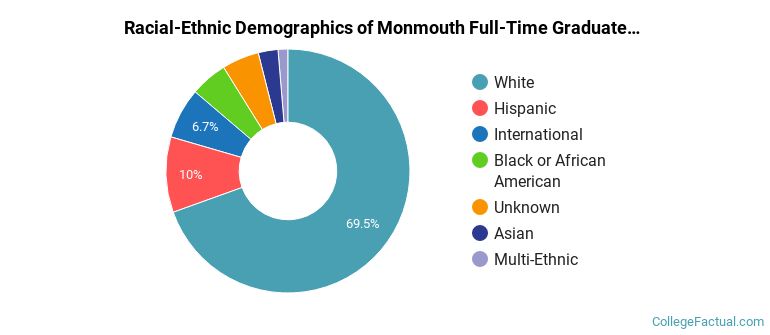
| Race/Ethnicity | Number |
|---|---|
| White | 444 |
| Hispanic | 64 |
| Black or African American | 33 |
| International | 27 |
| Unknown | 16 |
| Asian | 14 |
| Multi-Ethnic | 8 |
| Native Hawaiian or Pacific Islander | 1 |
See racial/ethnic breakdown for all students.

| Race/Ethnicity | Number |
|---|---|
| White | 3,924 |
| Hispanic | 783 |
| Black or African American | 330 |
| Unknown | 242 |
| Asian | 164 |
| Multi-Ethnic | 125 |
| International | 99 |
| Native Hawaiian or Pacific Islander | 3 |
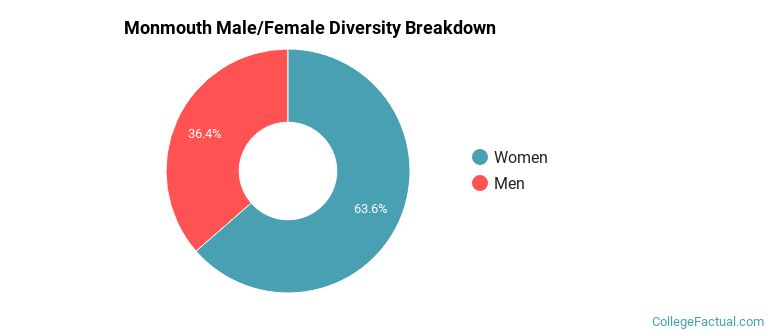
There are approximately 3,678 female students and 1,996 male students at Monmouth.
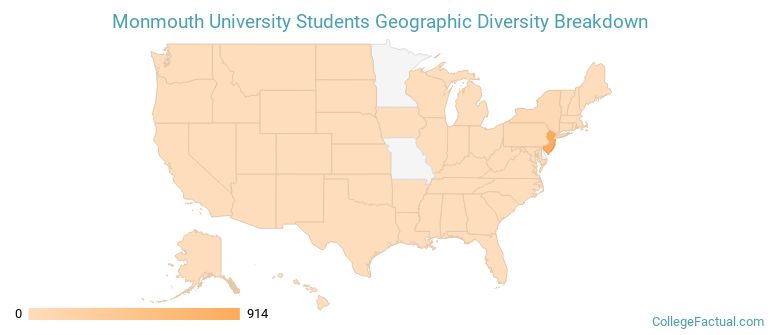
Monmouth ranks 1,318 out of 2,183 when it comes to geographic diversity.
15.76% of Monmouth students come from out of state, and 0.37% come from out of the country.
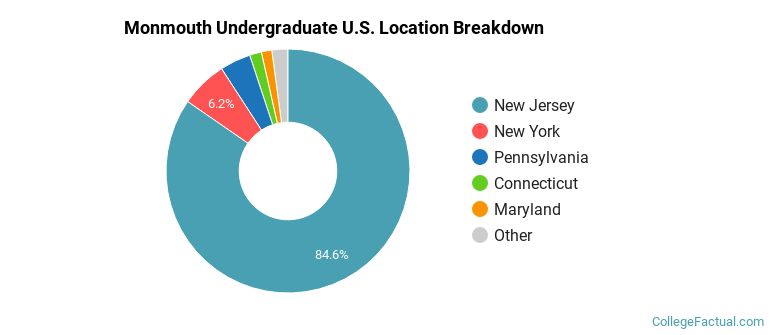
The undergraduate student body is split among 16 states (may include Washington D.C.). Click on the map for more detail.
| State | Amount |
|---|---|
| New Jersey | 914 |
| New York | 67 |
| Pennsylvania | 44 |
| Connecticut | 17 |
| Maryland | 15 |
Students from 35 countries are represented at this school, with the majority of the international students coming from India, Saudi Arabia, and China.
Learn more about international students at Monmouth.
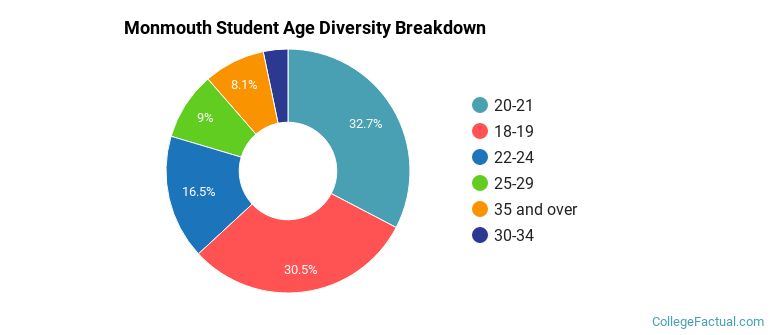
A traditional college student is defined as being between the ages of 18-21. At Monmouth, 62.49% of students fall into that category, compared to the national average of 60%.
| Student Age Group | Amount |
|---|---|
| 20-21 | 2,050 |
| 18-19 | 1,912 |
| 22-24 | 1,034 |
| 25-29 | 565 |
| 35 and over | 511 |
| 30-34 | 205 |
| Under 18 | 0 |
Footnotes
*The racial-ethnic minorities count is calculated by taking the total number of students and subtracting white students, international students, and students whose race/ethnicity was unknown. This number is then divided by the total number of students at the school to obtain the racial-ethnic minorities percentage.
References
Department of Homeland Security Citizenship and Immigration Services
Read College Factual's Diversity Ranking Methodology.