Here, you'll find out more about the major, including such details as the number of graduates, what degree levels are offered, ethnicity of students, average salaries, and more. We've also included details on how Montclair State ranks compared to other colleges offering a major in dance.
Go directly to any of the following sections:
The bachelor's program at Montclair State was ranked #45 on College Factual's Best Schools for dance list. It is also ranked #2 in New Jersey.
| Ranking Type | Rank |
|---|---|
| Best Dance Bachelor’s Degree Schools | 44 |
| Best Dance Schools | 45 |
During the 2021-2022 academic year, Montclair State University handed out 25 bachelor's degrees in dance. Last year, the same number of degrees were handed out.
In 2022, 4 students received their master’s degree in dance from Montclair State. This makes it the #21 most popular school for dance master’s degree candidates in the country.
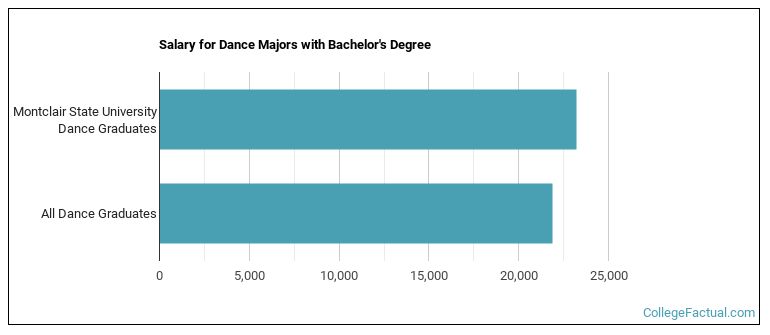
Dance majors who earn their bachelor's degree from Montclair State go on to jobs where they make a median salary of $23,191 a year. This is higher than $21,879, which is the national median for all dance bachelor's degree recipients.
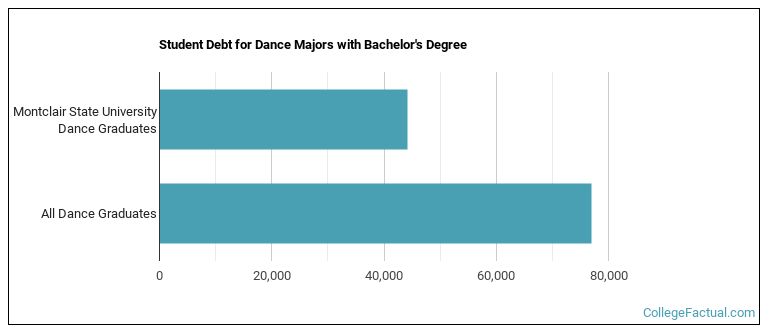
While getting their bachelor's degree at Montclair State, dance students borrow a median amount of $44,101 in student loans. This is not too bad considering that the median debt load of all dance bachelor's degree recipients across the country is $76,973.
Out-of-state part-time undergraduates at Montclair State paid an average of $769 per credit hour in 2022-2023. The average for in-state students was $457 per credit hour. Information about average full-time undergraduate tuition and fees is shown in the table below.
| In State | Out of State | |
|---|---|---|
| Tuition | $13,710 | $23,070 |
| Fees | $1,056 | $1,056 |
| Books and Supplies | $1,240 | $1,240 |
| On Campus Room and Board | $16,822 | $16,822 |
| On Campus Other Expenses | $2,200 | $2,200 |
Learn more about Montclair State tuition and fees.
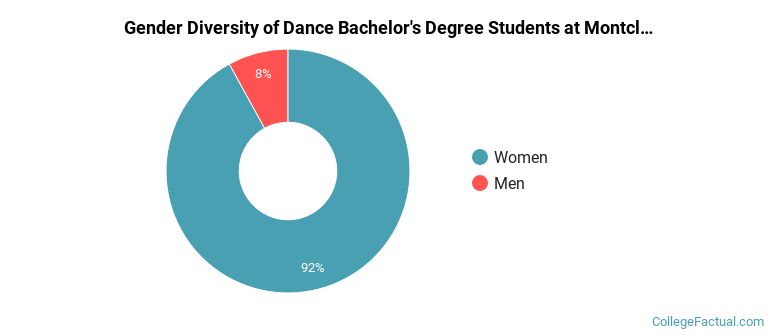
During the 2021-2022 academic year, 25 dance majors earned their bachelor's degree from Montclair State. Of these graduates, 8% were men and 92% were women.
The following table and chart show the ethnic background for students who recently graduated from Montclair State University with a bachelor's in dance.
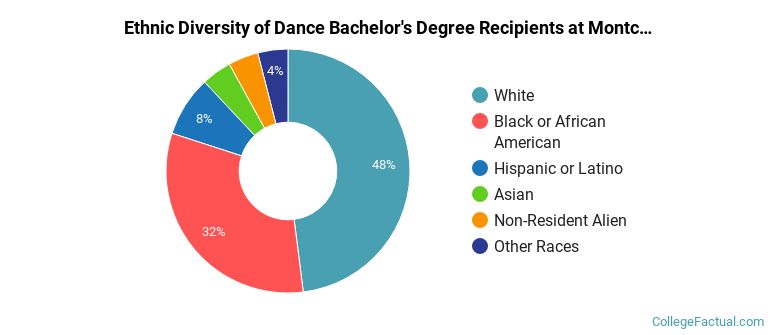
| Ethnic Background | Number of Students |
|---|---|
| Asian | 1 |
| Black or African American | 8 |
| Hispanic or Latino | 2 |
| White | 12 |
| Non-Resident Aliens | 1 |
| Other Races | 1 |
Online degrees for the Montclair State dance bachelor’s degree program are not available at this time. To see if the school offers distance learning options in other areas, visit the Montclair State Online Learning page.
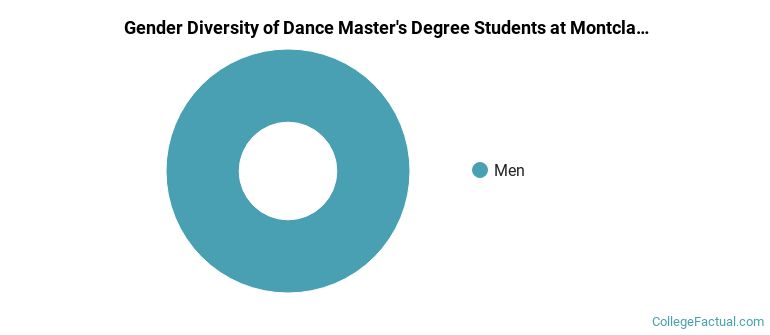
All of the 14 students who graduated with a Master’s in dance from Montclair State in 2022 were men.
The majority of master's degree recipients in this major at Montclair State are white. In the most recent graduating class for which data is available, 64% of students fell into this category.
The following table and chart show the ethnic background for students who recently graduated from Montclair State University with a master's in dance.
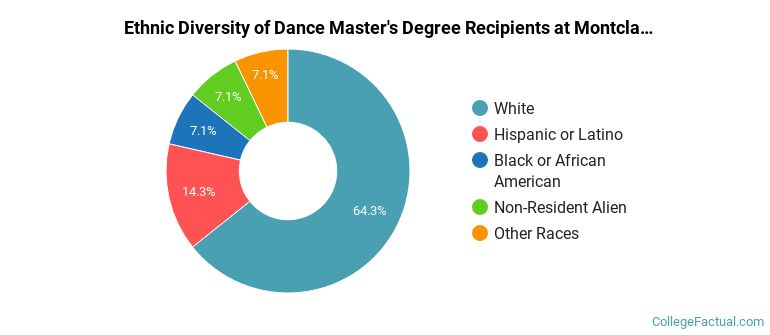
| Ethnic Background | Number of Students |
|---|---|
| Asian | 0 |
| Black or African American | 1 |
| Hispanic or Latino | 2 |
| White | 9 |
| Non-Resident Aliens | 1 |
| Other Races | 1 |
Take a look at the following statistics related to the make-up of the dance majors at Montclair State University.
| Related Major | Annual Graduates |
|---|---|
| Music | 96 |
| Design & Applied Arts | 86 |
| Drama & Theater Arts | 68 |
| Fine & Studio Arts | 51 |
| Film, Video & Photographic Arts | 47 |
More about our data sources and methodologies.