Here, you'll find out more about the major, including such details as the number of graduates, what degree levels are offered, ethnicity of students, and more. We've also included details on how Mt. Holyoke ranks compared to other colleges offering a major in theater.
Go directly to any of the following sections:
The bachelor's program at Mt. Holyoke was ranked #118 on College Factual's Best Schools for theater list. It is also ranked #6 in Massachusetts.
| Ranking Type | Rank |
|---|---|
| Best Drama & Theater Arts Bachelor’s Degree Schools | 114 |
| Best Drama & Theater Arts Schools | 118 |
During the 2021-2022 academic year, Mount Holyoke College handed out 10 bachelor's degrees in drama & theater arts. This is an increase of 43% over the previous year when 7 degrees were handed out.
During the 2022-2023 academic year, part-time undergraduate students at Mt. Holyoke paid an average of $1,997 per credit hour. No discount was available for in-state students. The following table shows the average full-time tuition and fees for undergraduates.
| In State | Out of State | |
|---|---|---|
| Tuition | $63,904 | $63,904 |
| Fees | $238 | $238 |
| Books and Supplies | $1,000 | $1,000 |
| On Campus Room and Board | $18,838 | $18,838 |
| On Campus Other Expenses | $1,000 | $1,000 |
Learn more about Mt. Holyoke tuition and fees.
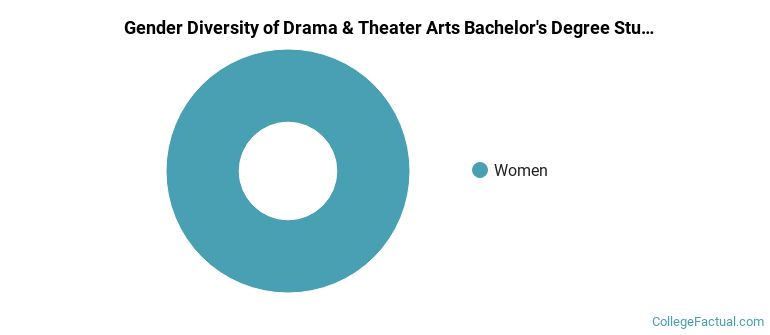
All of the 10 students who graduated with a Bachelor’s in theater from Mt. Holyoke in 2022 were women.
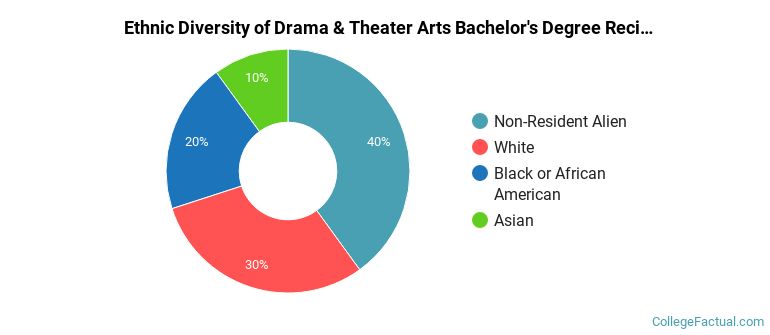
The following table and chart show the ethnic background for students who recently graduated from Mount Holyoke College with a bachelor's in theater.
| Ethnic Background | Number of Students |
|---|---|
| Asian | 1 |
| Black or African American | 2 |
| Hispanic or Latino | 0 |
| White | 3 |
| Non-Resident Aliens | 4 |
| Other Races | 0 |
Mt. Holyoke does not offer an online option for its theater bachelor’s degree program at this time. To see if the school offers distance learning options in other areas, visit the Mt. Holyoke Online Learning page.
Take a look at the following statistics related to the make-up of the theater majors at Mount Holyoke College.
| Related Major | Annual Graduates |
|---|---|
| Fine & Studio Arts | 29 |
| Music | 11 |
| Film, Video & Photographic Arts | 7 |
| Other Visual Art | 7 |
| Dance | 3 |
More about our data sources and methodologies.