Mount Saint Mary total enrollment is approximately 2,125 students. 1,479 are undergraduates and 50 are graduate students.
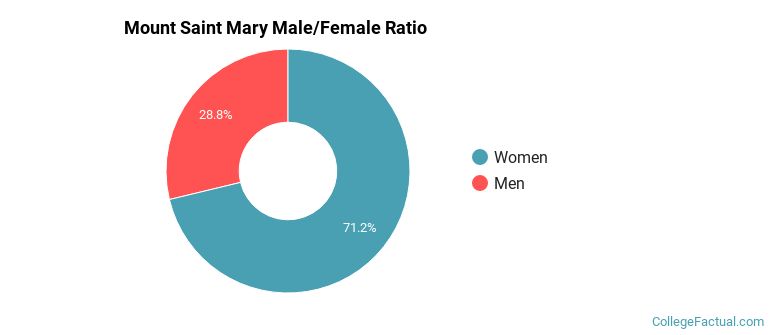
Male/Female Breakdown of Undergraduates
The full-time Mount Saint Mary undergraduate population is made up of 73% women, and 27% men.
For the gender breakdown for all students, go here.
Mount Saint Mary Racial/Ethnic Breakdown of Undergraduates
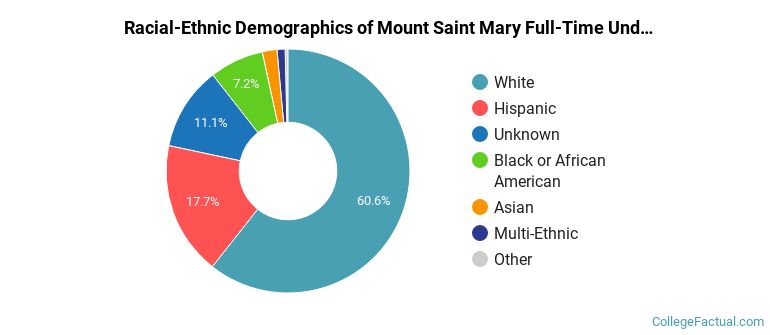
| Race/Ethnicity | Number |
|---|---|
| White | 896 |
| Hispanic | 287 |
| Unknown | 136 |
| Black or African American | 104 |
| Asian | 29 |
| Multi-Ethnic | 17 |
| International | 4 |
| Native Hawaiian or Pacific Islander | 0 |
See racial/ethnic breakdown for all students.
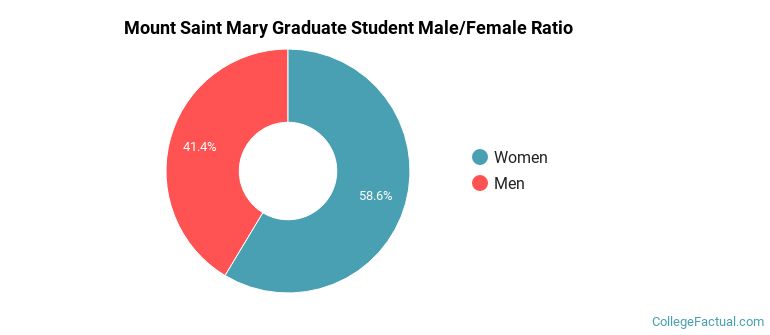
Male/Female Breakdown of Graduate Students
About 56% of full-time grad students are women, and 44% men.
For the gender breakdown for all students, go here.
Mount Saint Mary Racial-Ethnic Breakdown of Graduate Students
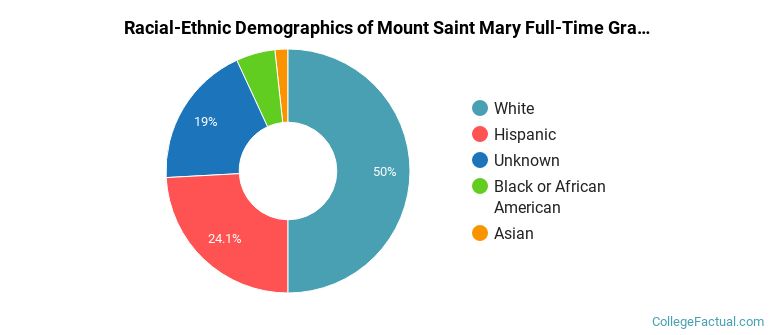
| Race/Ethnicity | Number |
|---|---|
| White | 30 |
| Hispanic | 8 |
| Unknown | 8 |
| Black or African American | 3 |
| Multi-Ethnic | 1 |
| Asian | 0 |
| Native Hawaiian or Pacific Islander | 0 |
| International | 0 |
See racial/ethnic breakdown for all students.

| Race/Ethnicity | Number |
|---|---|
| White | 1,206 |
| Hispanic | 369 |
| Unknown | 299 |
| Black or African American | 161 |
| Asian | 51 |
| Multi-Ethnic | 24 |
| International | 6 |
| Native Hawaiian or Pacific Islander | 1 |

There are approximately 1,571 female students and 554 male students at Mount Saint Mary.
Mount Saint Mary ranks 1,587 out of 2,183 when it comes to geographic diversity.
16.8% of Mount Saint Mary students come from out of state, and 0% come from out of the country.

The undergraduate student body is split among 7 states (may include Washington D.C.). Click on the map for more detail.

| State | Amount |
|---|---|
| New York | 322 |
| Connecticut | 31 |
| New Jersey | 28 |
| Massachusetts | 3 |
| California | 1 |
Students from 8 countries are represented at this school, with the majority of the international students coming from China, Slovakia, and Belarus.
Learn more about international students at Mount Saint Mary.
A traditional college student is defined as being between the ages of 18-21. At Mount Saint Mary, 57.89% of students fall into that category, compared to the national average of 60%.

| Student Age Group | Amount |
|---|---|
| 18-19 | 688 |
| 20-21 | 681 |
| 22-24 | 335 |
| 35 and over | 253 |
| 25-29 | 228 |
| 30-34 | 118 |
| Under 18 | 0 |
Footnotes
*The racial-ethnic minorities count is calculated by taking the total number of students and subtracting white students, international students, and students whose race/ethnicity was unknown. This number is then divided by the total number of students at the school to obtain the racial-ethnic minorities percentage.
References
Department of Homeland Security Citizenship and Immigration Services
Image Credit: By Dasandman008 under License