MSMU total enrollment is approximately 2,745 students. 1,607 are undergraduates and 592 are graduate students.
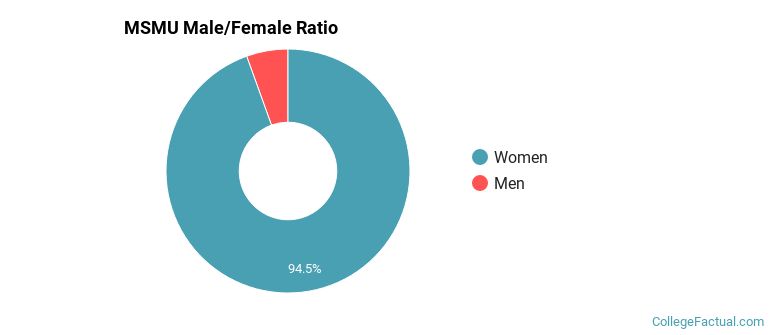
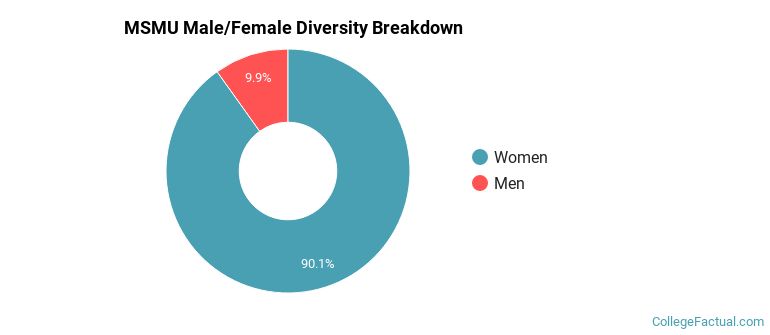
Male/Female Breakdown of Undergraduates
The full-time MSMU undergraduate population is made up of 95% women, and 5% men.
For the gender breakdown for all students, go here.
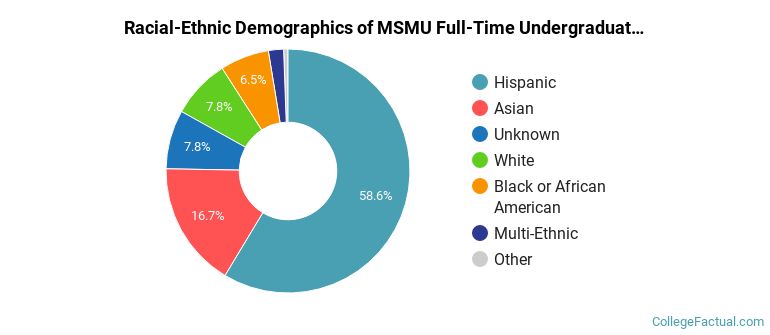
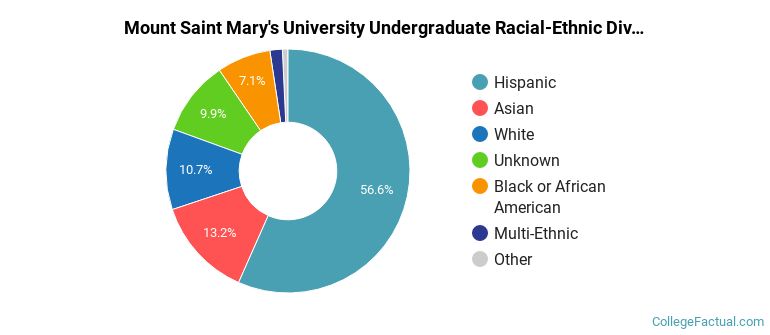
MSMU Racial/Ethnic Breakdown of Undergraduates
| Race/Ethnicity | Number |
|---|---|
| Hispanic | 937 |
| Asian | 261 |
| White | 141 |
| Unknown | 140 |
| Black or African American | 92 |
| Multi-Ethnic | 23 |
| Native Hawaiian or Pacific Islander | 5 |
| International | 3 |
See racial/ethnic breakdown for all students.
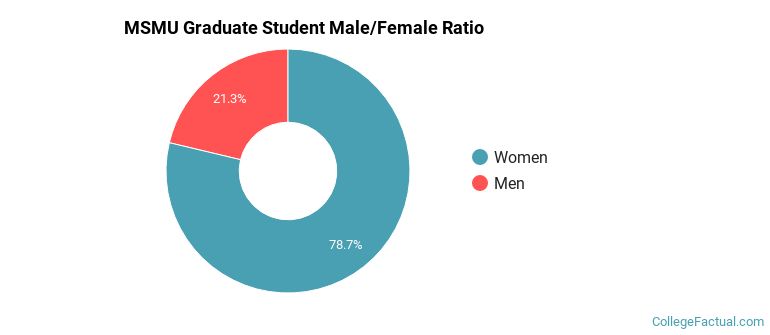
Male/Female Breakdown of Graduate Students
About 78% of full-time grad students are women, and 22% men.
For the gender breakdown for all students, go here.
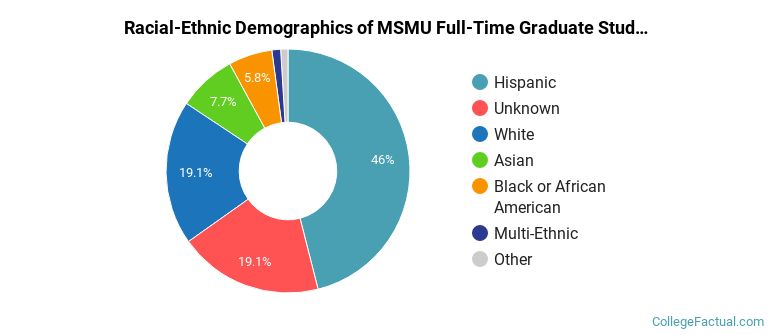
MSMU Racial-Ethnic Breakdown of Graduate Students
| Race/Ethnicity | Number |
|---|---|
| Hispanic | 269 |
| Unknown | 132 |
| White | 107 |
| Black or African American | 43 |
| Asian | 28 |
| Multi-Ethnic | 6 |
| International | 5 |
| Native Hawaiian or Pacific Islander | 2 |
See racial/ethnic breakdown for all students.
| Race/Ethnicity | Number |
|---|---|
| Hispanic | 1,494 |
| Asian | 337 |
| Unknown | 333 |
| White | 329 |
| Black or African American | 192 |
| Multi-Ethnic | 37 |
| Native Hawaiian or Pacific Islander | 9 |
| International | 8 |
There are approximately 2,455 female students and 290 male students at MSMU.
MSMU ranks 1,483 out of 2,183 when it comes to geographic diversity.
3.67% of MSMU students come from out of state, and 0% come from out of the country.
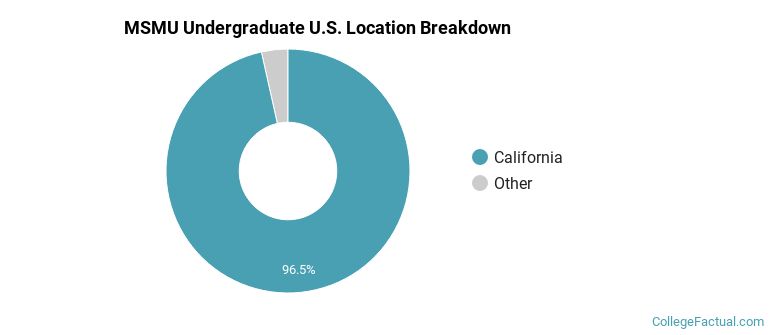
The undergraduate student body is split among 13 states (may include Washington D.C.). Click on the map for more detail.
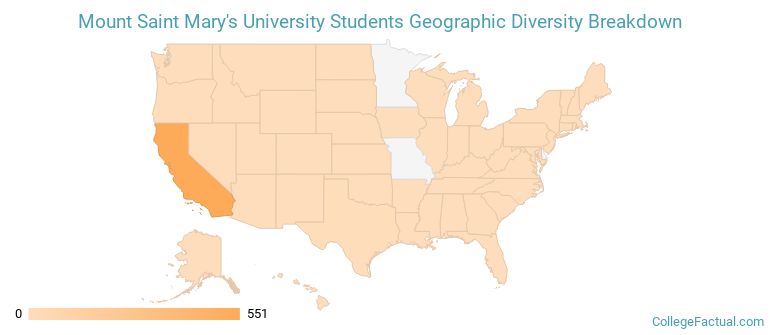
| State | Amount |
|---|---|
| California | 551 |
| Texas | 4 |
| Arizona | 2 |
| Florida | 2 |
| Hawaii | 2 |
Students from 21 countries are represented at this school, with the majority of the international students coming from China, South Korea, and Canada.
Learn more about international students at MSMU.
A traditional college student is defined as being between the ages of 18-21. At MSMU, 48.95% of students fall into that category, compared to the national average of 60%.
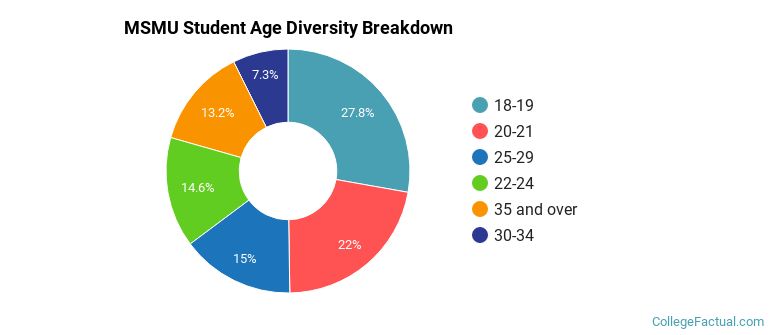
| Student Age Group | Amount |
|---|---|
| 18-19 | 882 |
| 20-21 | 697 |
| 25-29 | 477 |
| 22-24 | 464 |
| 35 and over | 420 |
| 30-34 | 233 |
| Under 18 | 0 |
Footnotes
*The racial-ethnic minorities count is calculated by taking the total number of students and subtracting white students, international students, and students whose race/ethnicity was unknown. This number is then divided by the total number of students at the school to obtain the racial-ethnic minorities percentage.
References
Department of Homeland Security Citizenship and Immigration Services
Image Credit: By Dasandman008 under License