NLU total enrollment is approximately 7,402 students. 2,564 are undergraduates and 1,664 are graduate students.
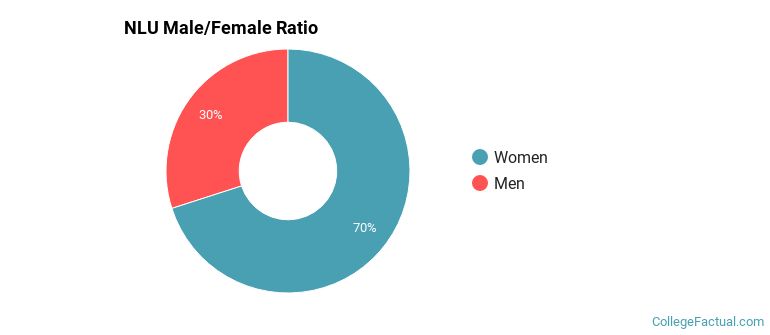
Male/Female Breakdown of Undergraduates
The full-time NLU undergraduate population is made up of 70% women, and 30% men.
For the gender breakdown for all students, go here.
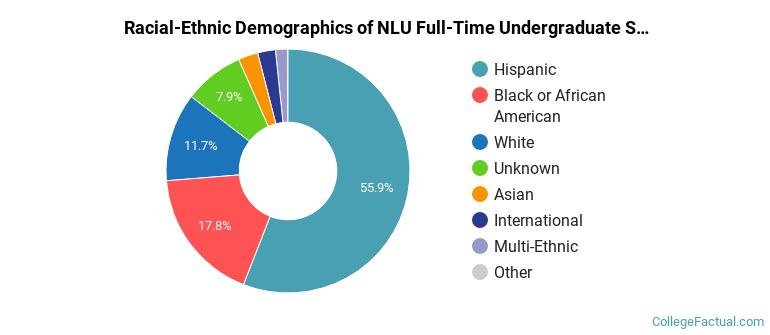
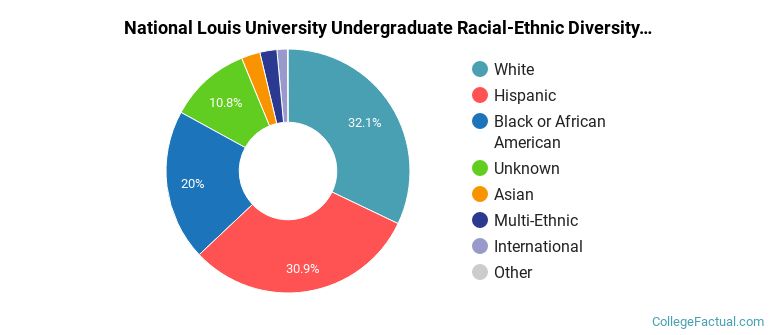
NLU Racial/Ethnic Breakdown of Undergraduates
| Race/Ethnicity | Number |
|---|---|
| Hispanic | 1,542 |
| Black or African American | 439 |
| White | 303 |
| Unknown | 142 |
| Asian | 58 |
| International | 47 |
| Multi-Ethnic | 32 |
| Native Hawaiian or Pacific Islander | 0 |
See racial/ethnic breakdown for all students.
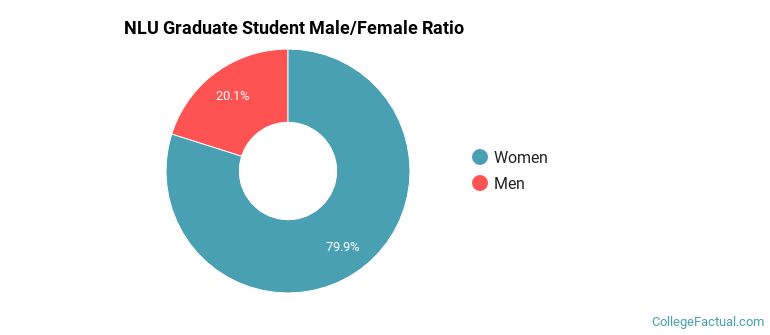
Male/Female Breakdown of Graduate Students
About 80% of full-time grad students are women, and 20% men.
For the gender breakdown for all students, go here.
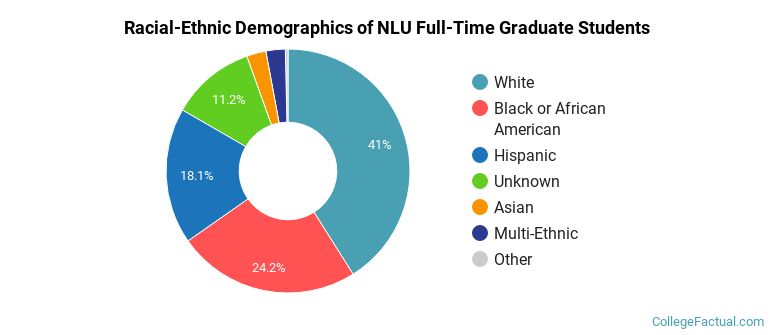
NLU Racial-Ethnic Breakdown of Graduate Students
| Race/Ethnicity | Number |
|---|---|
| White | 673 |
| Black or African American | 415 |
| Hispanic | 326 |
| Unknown | 145 |
| Multi-Ethnic | 49 |
| Asian | 43 |
| International | 11 |
| Native Hawaiian or Pacific Islander | 0 |
See racial/ethnic breakdown for all students.
| Race/Ethnicity | Number |
|---|---|
| Hispanic | 2,585 |
| White | 2,252 |
| Black or African American | 1,492 |
| Unknown | 647 |
| Asian | 185 |
| Multi-Ethnic | 154 |
| International | 76 |
| Native Hawaiian or Pacific Islander | 1 |

There are approximately 5,772 female students and 1,630 male students at NLU.
NLU ranks 1,973 out of 2,183 when it comes to geographic diversity.
0.32% of NLU students come from out of state, and 0% come from out of the country.
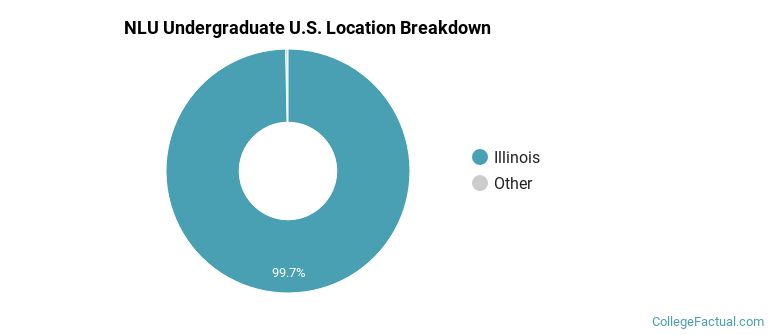
The undergraduate student body is split among 2 states (may include Washington D.C.). Click on the map for more detail.
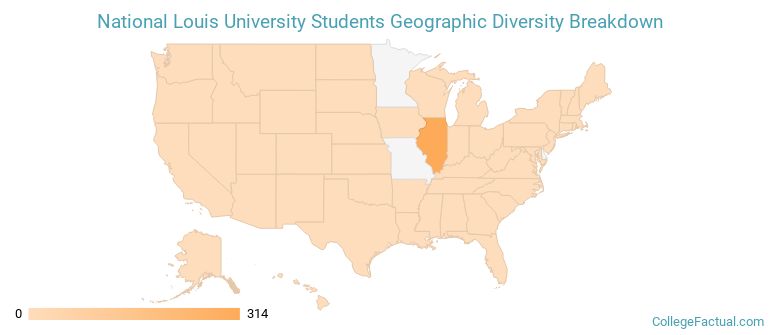
| State | Amount |
|---|---|
| Illinois | 314 |
| Indiana | 1 |
| Alaska | 0 |
| Alabama | 0 |
| Arkansas | 0 |
Students from 19 countries are represented at this school, with the majority of the international students coming from India, South Korea, and Kyrgyzstan.
Learn more about international students at NLU.
A traditional college student is defined as being between the ages of 18-21. At NLU, 16.14% of students fall into that category, compared to the national average of 60%.
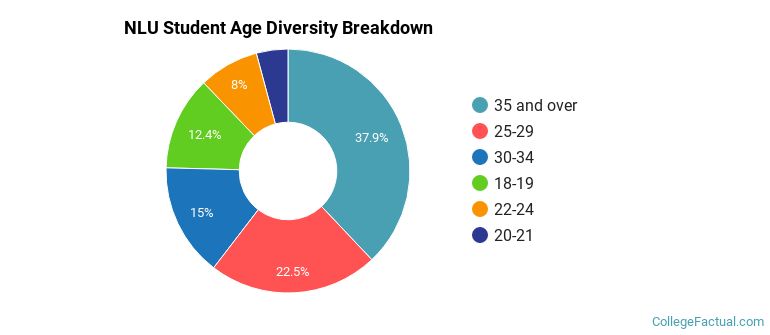
| Student Age Group | Amount |
|---|---|
| 35 and over | 1,812 |
| 25-29 | 1,073 |
| 30-34 | 716 |
| 18-19 | 594 |
| 22-24 | 380 |
| 20-21 | 200 |
| Under 18 | 0 |
Footnotes
*The racial-ethnic minorities count is calculated by taking the total number of students and subtracting white students, international students, and students whose race/ethnicity was unknown. This number is then divided by the total number of students at the school to obtain the racial-ethnic minorities percentage.
References
Department of Homeland Security Citizenship and Immigration Services
Image Credit: By TonyTheTiger under License
Read College Factual's Diversity Ranking Methodology.