NSC total enrollment is approximately 7,289 students. 2,079 are undergraduates and 20 are graduate students.
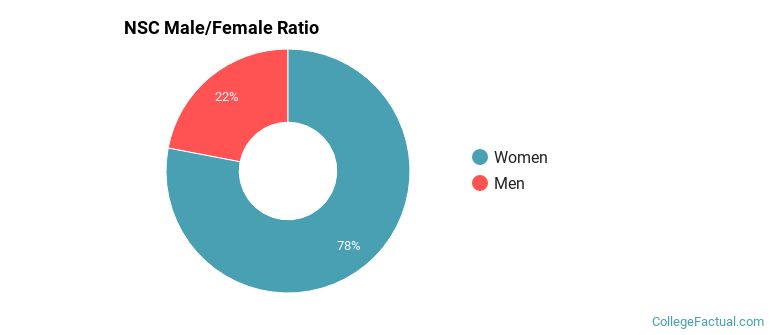
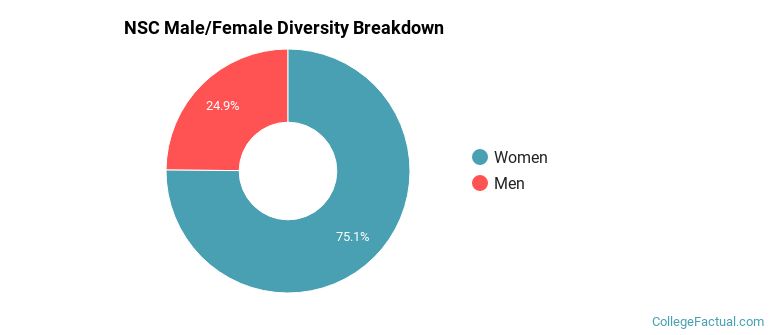
Male/Female Breakdown of Undergraduates
The full-time NSC undergraduate population is made up of 80% women, and 20% men.
For the gender breakdown for all students, go here.
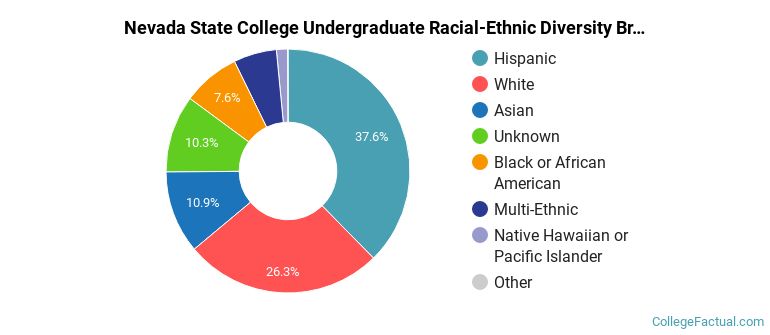
NSC Racial/Ethnic Breakdown of Undergraduates
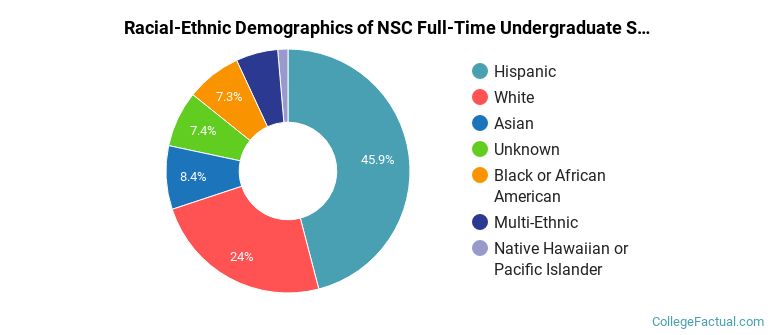
| Race/Ethnicity | Number |
|---|---|
| Hispanic | 966 |
| White | 486 |
| Asian | 179 |
| Black or African American | 162 |
| Unknown | 148 |
| Multi-Ethnic | 113 |
| Native Hawaiian or Pacific Islander | 14 |
| International | 0 |
See racial/ethnic breakdown for all students.
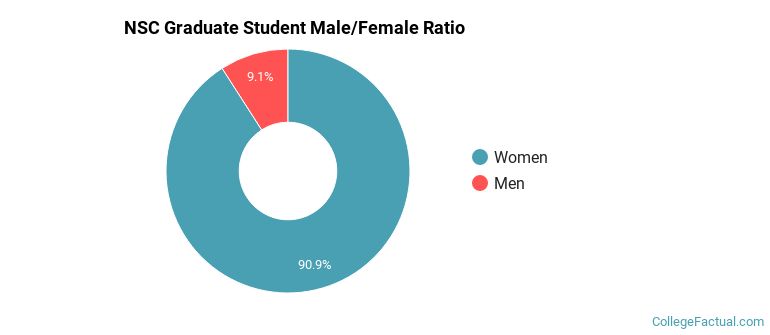
Male/Female Breakdown of Graduate Students
About 85% of full-time grad students are women, and 15% men.
For the gender breakdown for all students, go here.
NSC Racial-Ethnic Breakdown of Graduate Students
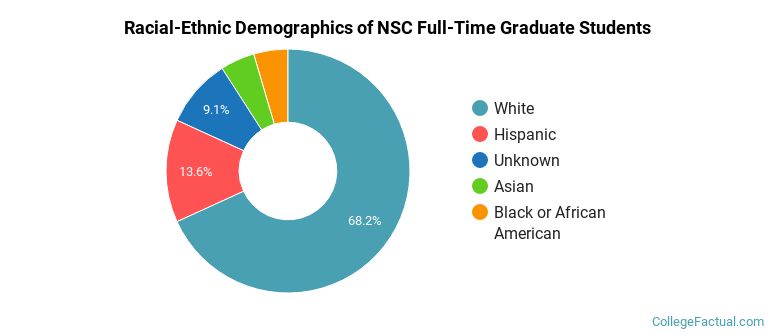
| Race/Ethnicity | Number |
|---|---|
| White | 9 |
| Black or African American | 3 |
| Hispanic | 3 |
| Asian | 2 |
| Unknown | 2 |
| Native Hawaiian or Pacific Islander | 1 |
| International | 0 |
| Multi-Ethnic | 0 |
See racial/ethnic breakdown for all students.
| Race/Ethnicity | Number |
|---|---|
| Hispanic | 2,830 |
| White | 1,524 |
| Unknown | 1,000 |
| Asian | 845 |
| Black or African American | 551 |
| Multi-Ethnic | 432 |
| Native Hawaiian or Pacific Islander | 86 |
| International | 3 |
There are approximately 5,411 female students and 1,878 male students at NSC.
NSC ranks 2,095 out of 2,183 when it comes to geographic diversity.
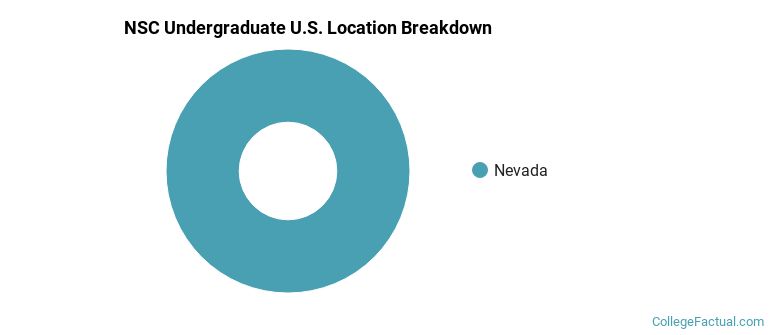
The undergraduate student body is split among 1 states (may include Washington D.C.). Click on the map for more detail.
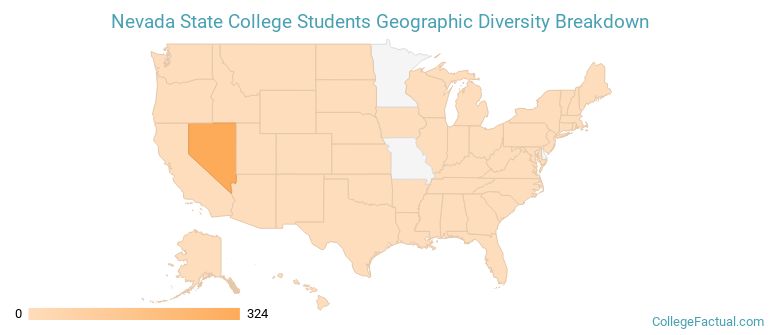
| State | Amount |
|---|---|
| Nevada | 324 |
| Alaska | 0 |
| Alabama | 0 |
| Arkansas | 0 |
| Arizona | 0 |
A traditional college student is defined as being between the ages of 18-21. At NSC, 30.17% of students fall into that category, compared to the national average of 60%.
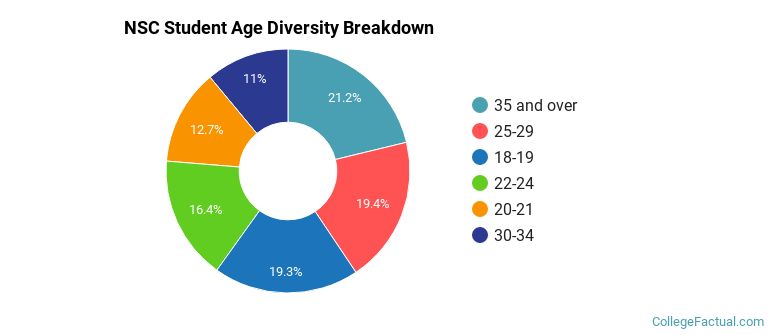
| Student Age Group | Amount |
|---|---|
| 35 and over | 844 |
| 25-29 | 771 |
| 18-19 | 768 |
| 22-24 | 652 |
| 20-21 | 504 |
| 30-34 | 439 |
| Under 18 | 0 |
Footnotes
*The racial-ethnic minorities count is calculated by taking the total number of students and subtracting white students, international students, and students whose race/ethnicity was unknown. This number is then divided by the total number of students at the school to obtain the racial-ethnic minorities percentage.
References