NJIT total enrollment is approximately 11,652 students. 7,389 are undergraduates and 1,360 are graduate students.
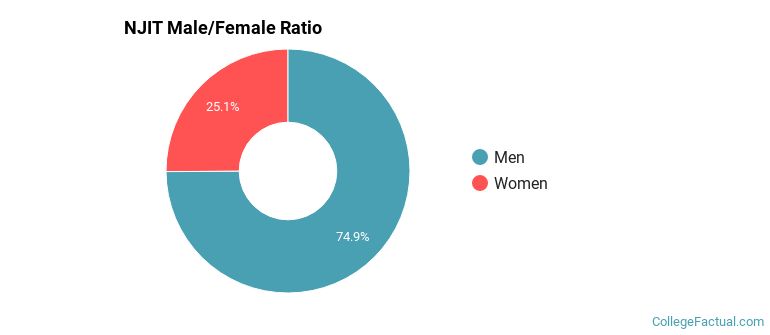
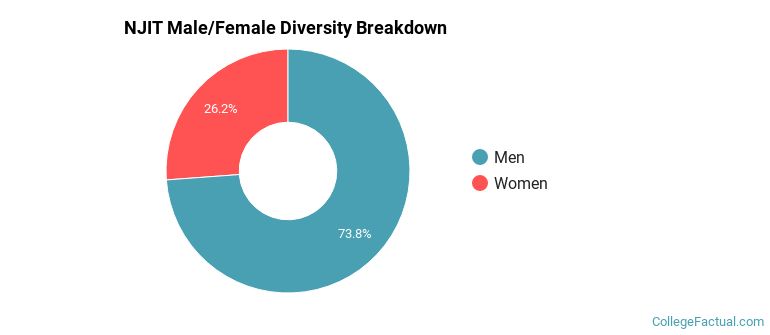
Male/Female Breakdown of Undergraduates
The full-time NJIT undergraduate population is made up of 25% women, and 75% men.
For the gender breakdown for all students, go here.
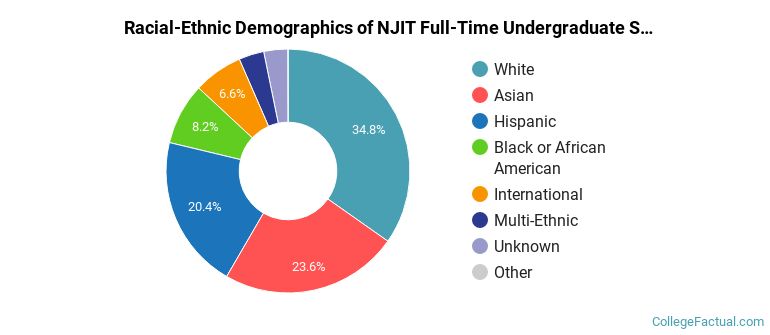
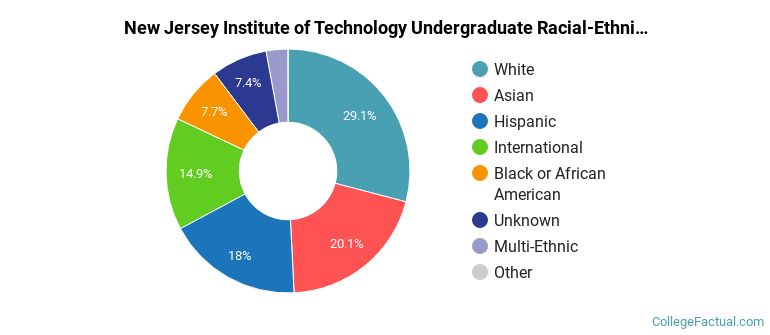
NJIT Racial/Ethnic Breakdown of Undergraduates
| Race/Ethnicity | Number |
|---|---|
| White | 2,479 |
| Asian | 1,755 |
| Hispanic | 1,512 |
| International | 623 |
| Black or African American | 578 |
| Multi-Ethnic | 258 |
| Unknown | 169 |
| Native Hawaiian or Pacific Islander | 3 |
See racial/ethnic breakdown for all students.
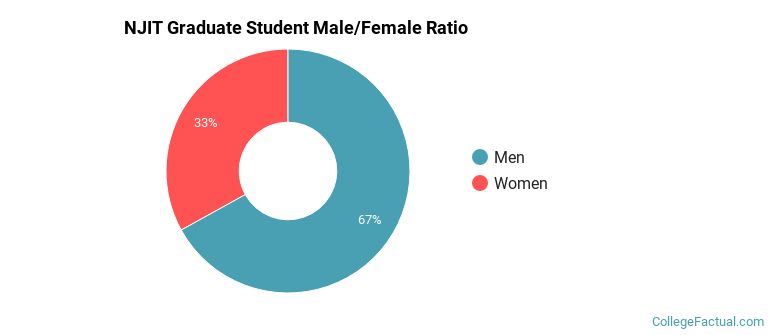
Male/Female Breakdown of Graduate Students
About 33% of full-time grad students are women, and 67% men.
For the gender breakdown for all students, go here.
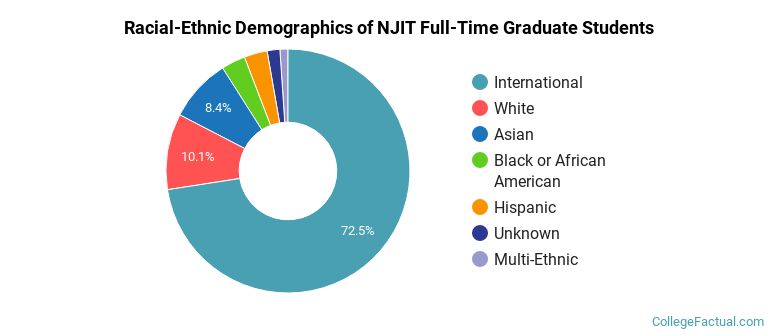
NJIT Racial-Ethnic Breakdown of Graduate Students
| Race/Ethnicity | Number |
|---|---|
| International | 888 |
| White | 184 |
| Asian | 142 |
| Hispanic | 65 |
| Black or African American | 54 |
| Multi-Ethnic | 15 |
| Unknown | 12 |
| Native Hawaiian or Pacific Islander | 0 |
See racial/ethnic breakdown for all students.
| Race/Ethnicity | Number |
|---|---|
| White | 3,454 |
| Asian | 2,371 |
| Hispanic | 2,043 |
| International | 1,688 |
| Black or African American | 898 |
| Unknown | 823 |
| Multi-Ethnic | 350 |
| Native Hawaiian or Pacific Islander | 6 |
There are approximately 3,154 female students and 8,498 male students at NJIT.
NJIT ranks 1,512 out of 2,183 when it comes to geographic diversity.
5.2% of NJIT students come from out of state, and 0.91% come from out of the country.
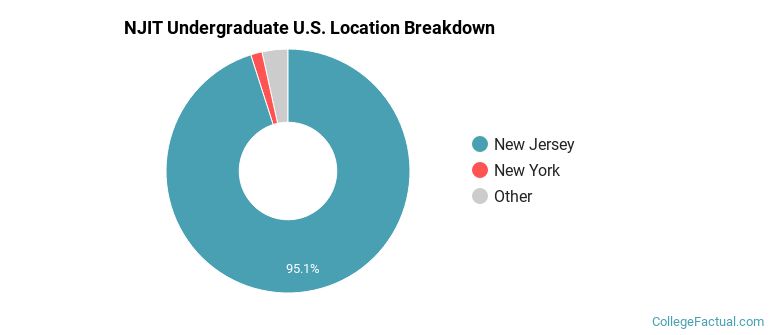
The undergraduate student body is split among 14 states (may include Washington D.C.). Click on the map for more detail.
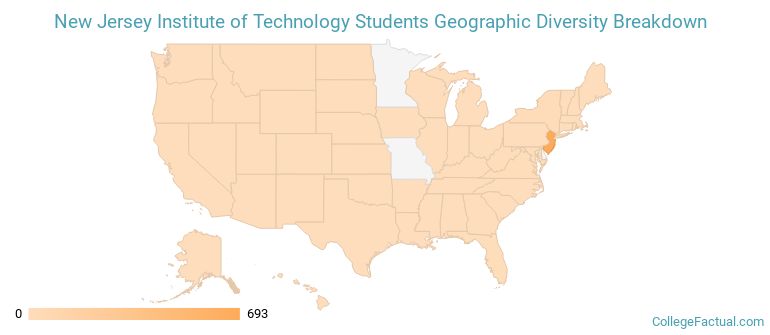
| State | Amount |
|---|---|
| New Jersey | 693 |
| New York | 11 |
| Florida | 4 |
| Maryland | 4 |
| Virginia | 4 |
Students from 86 countries are represented at this school, with the majority of the international students coming from India, China, and Taiwan.
Learn more about international students at NJIT.
A traditional college student is defined as being between the ages of 18-21. At NJIT, 42.04% of students fall into that category, compared to the national average of 60%.
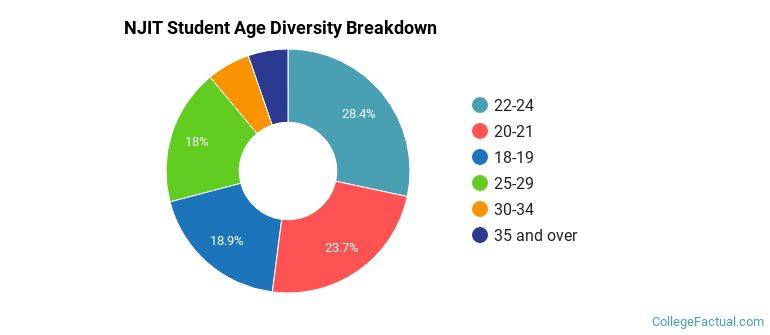
| Student Age Group | Amount |
|---|---|
| 22-24 | 3,206 |
| 20-21 | 2,678 |
| 18-19 | 2,134 |
| 25-29 | 2,039 |
| 30-34 | 650 |
| 35 and over | 598 |
| Under 18 | 0 |
Footnotes
*The racial-ethnic minorities count is calculated by taking the total number of students and subtracting white students, international students, and students whose race/ethnicity was unknown. This number is then divided by the total number of students at the school to obtain the racial-ethnic minorities percentage.
References
Department of Homeland Security Citizenship and Immigration Services
Image Credit: By Jim.henderson under License
Read College Factual's Diversity Ranking Methodology.