Here, you'll find out more about the major, including such details as the number of graduates, what degree levels are offered, ethnicity of students, and more. We've also included details on how New York Conservatory for Dramatic Arts ranks compared to other colleges offering a major in theater.
Jump to any of the following sections:
The bachelor's program at New York Conservatory for Dramatic Arts was ranked #299 on College Factual's Best Schools for theater list.
The average full-time tuition and fees for undergraduates are shown in the table below.
| In State | Out of State | |
|---|---|---|
| Tuition | $36,200 | $36,200 |
| Fees | $1,000 | $1,000 |
| Books and Supplies | $300 | $300 |
Learn more about New York Conservatory for Dramatic Arts tuition and fees.
Online degrees for the New York Conservatory for Dramatic Arts theater bachelor’s degree program are not available at this time. To see if the school offers distance learning options in other areas, visit the New York Conservatory for Dramatic Arts Online Learning page.
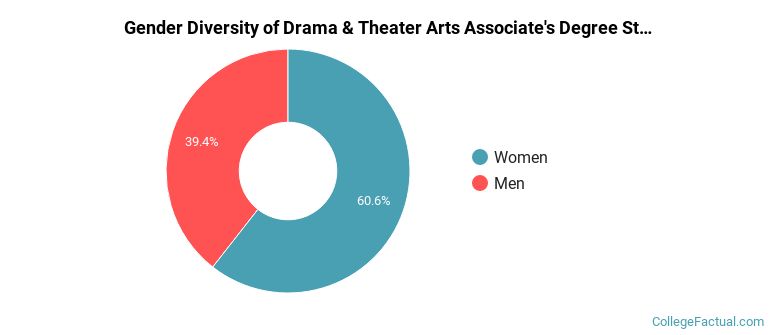
Of the 104 students who graduated with a Associate’s in theater from New York Conservatory for Dramatic Arts in 2022, 39% were men and 61% were women.
The following table and chart show the ethnic background for students who recently graduated from New York Conservatory for Dramatic Arts with a associate's in theater.
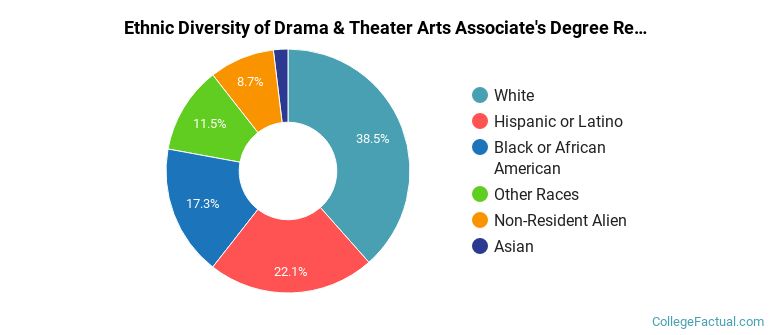
| Ethnic Background | Number of Students |
|---|---|
| Asian | 2 |
| Black or African American | 18 |
| Hispanic or Latino | 23 |
| White | 40 |
| Non-Resident Aliens | 9 |
| Other Races | 12 |