NYIT total enrollment is approximately 6,851 students. 3,155 are undergraduates and 2,814 are graduate students.
Male/Female Breakdown of Undergraduates
The full-time NYIT undergraduate population is made up of 41% women, and 59% men.

For the gender breakdown for all students, go here.
NYIT Racial/Ethnic Breakdown of Undergraduates

| Race/Ethnicity | Number |
|---|---|
| White | 815 |
| Asian | 771 |
| Hispanic | 615 |
| Black or African American | 312 |
| International | 301 |
| Multi-Ethnic | 158 |
| Unknown | 158 |
| Native Hawaiian or Pacific Islander | 15 |
See racial/ethnic breakdown for all students.
Male/Female Breakdown of Graduate Students
About 51% of full-time grad students are women, and 49% men.

For the gender breakdown for all students, go here.
NYIT Racial-Ethnic Breakdown of Graduate Students

| Race/Ethnicity | Number |
|---|---|
| White | 954 |
| Asian | 761 |
| International | 410 |
| Unknown | 349 |
| Hispanic | 147 |
| Black or African American | 127 |
| Multi-Ethnic | 65 |
| Native Hawaiian or Pacific Islander | 1 |
See racial/ethnic breakdown for all students.

| Race/Ethnicity | Number |
|---|---|
| White | 2,022 |
| Asian | 1,655 |
| Hispanic | 878 |
| International | 835 |
| Unknown | 643 |
| Black or African American | 548 |
| Multi-Ethnic | 239 |
| Native Hawaiian or Pacific Islander | 21 |
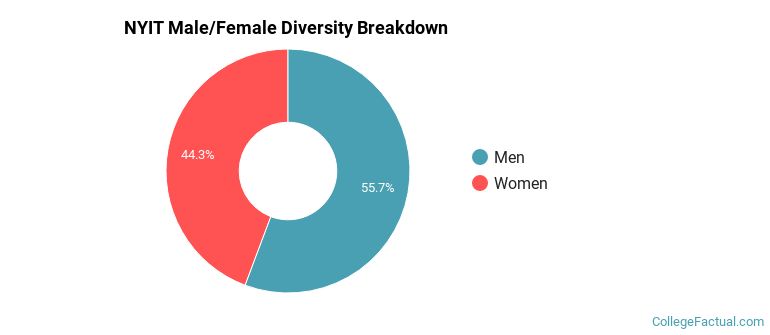
There are approximately 3,178 female students and 3,673 male students at NYIT.
NYIT ranks 971 out of 2,183 when it comes to geographic diversity.
16.46% of NYIT students come from out of state, and 8.84% come from out of the country.

The undergraduate student body is split among 24 states (may include Washington D.C.). Click on the map for more detail.

| State | Amount |
|---|---|
| New York | 538 |
| New Jersey | 54 |
| Florida | 7 |
| California | 5 |
| Connecticut | 5 |
Students from 99 countries are represented at this school, with the majority of the international students coming from India, China, and Saudi Arabia.
Learn more about international students at NYIT.
A traditional college student is defined as being between the ages of 18-21. At NYIT, 34.36% of students fall into that category, compared to the national average of 60%.

| Student Age Group | Amount |
|---|---|
| 22-24 | 2,213 |
| 25-29 | 1,834 |
| 18-19 | 1,298 |
| 20-21 | 1,246 |
| 35 and over | 410 |
| 30-34 | 363 |
| Under 18 | 0 |
Footnotes
*The racial-ethnic minorities count is calculated by taking the total number of students and subtracting white students, international students, and students whose race/ethnicity was unknown. This number is then divided by the total number of students at the school to obtain the racial-ethnic minorities percentage.
References
Department of Homeland Security Citizenship and Immigration Services
Image Credit: By Leginius The Angry under License
Read College Factual's Diversity Ranking Methodology.