North Central total enrollment is approximately 2,832 students. 2,414 are undergraduates and 295 are graduate students.
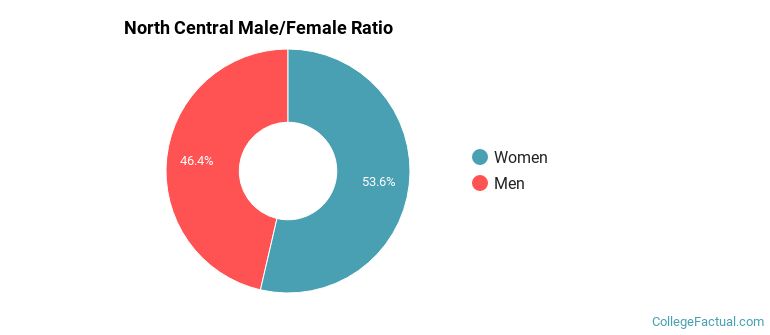
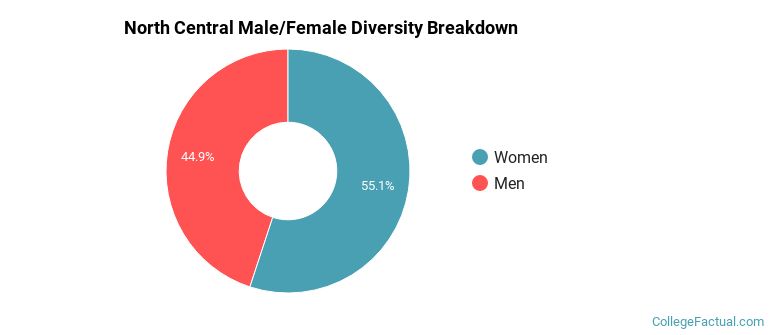
Male/Female Breakdown of Undergraduates
The full-time North Central undergraduate population is made up of 54% women, and 46% men.
For the gender breakdown for all students, go here.
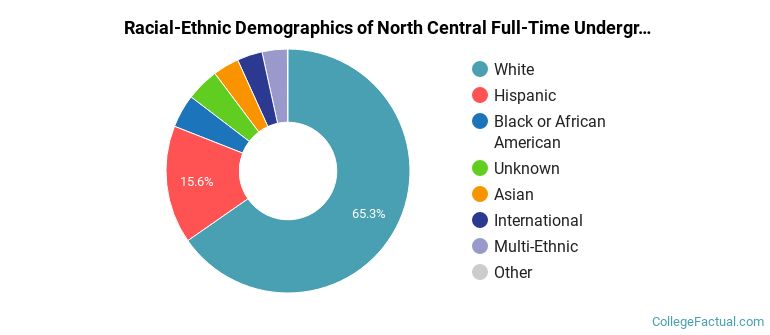
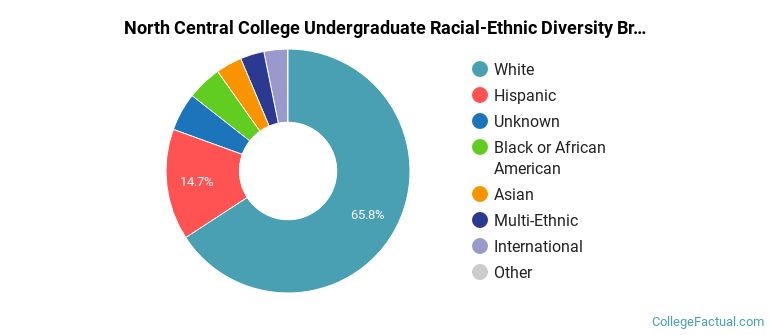
North Central Racial/Ethnic Breakdown of Undergraduates
| Race/Ethnicity | Number |
|---|---|
| White | 1,581 |
| Hispanic | 381 |
| Black or African American | 108 |
| Unknown | 94 |
| Asian | 84 |
| International | 81 |
| Multi-Ethnic | 79 |
| Native Hawaiian or Pacific Islander | 3 |
See racial/ethnic breakdown for all students.
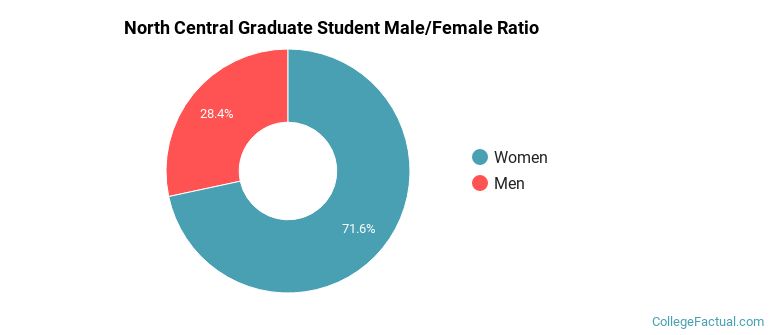
Male/Female Breakdown of Graduate Students
About 72% of full-time grad students are women, and 28% men.
For the gender breakdown for all students, go here.
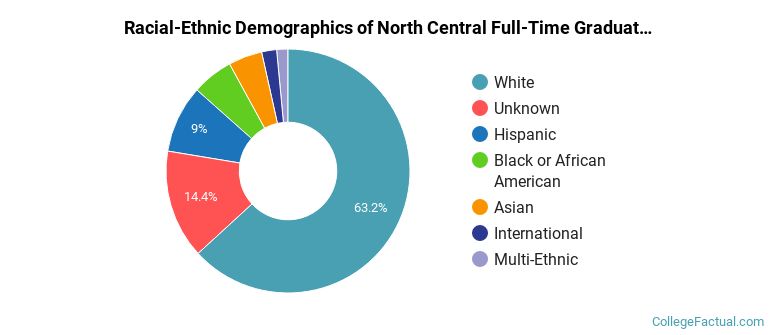
North Central Racial-Ethnic Breakdown of Graduate Students
| Race/Ethnicity | Number |
|---|---|
| White | 212 |
| Hispanic | 27 |
| Unknown | 24 |
| Black or African American | 18 |
| Asian | 7 |
| Multi-Ethnic | 4 |
| International | 2 |
| Native Hawaiian or Pacific Islander | 0 |
See racial/ethnic breakdown for all students.
| Race/Ethnicity | Number |
|---|---|
| White | 1,877 |
| Hispanic | 420 |
| Black or African American | 131 |
| Unknown | 131 |
| Asian | 95 |
| Multi-Ethnic | 86 |
| International | 83 |
| Native Hawaiian or Pacific Islander | 5 |
There are approximately 1,592 female students and 1,240 male students at North Central.
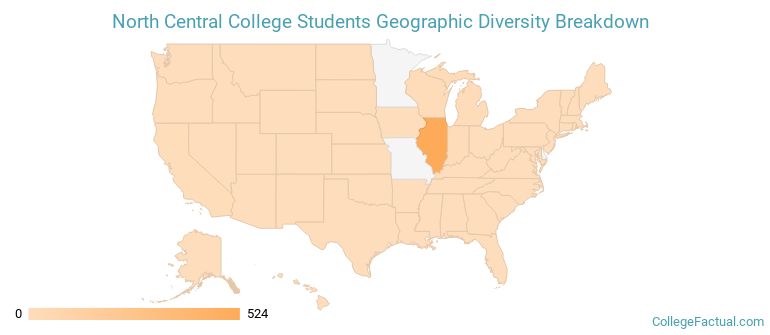
North Central ranks 1,386 out of 2,183 when it comes to geographic diversity.
9.81% of North Central students come from out of state, and 1.36% come from out of the country.
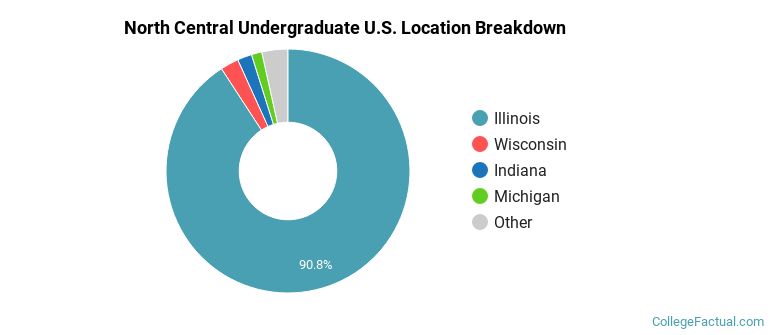
The undergraduate student body is split among 16 states (may include Washington D.C.). Click on the map for more detail.
| State | Amount |
|---|---|
| Illinois | 524 |
| Wisconsin | 14 |
| Indiana | 11 |
| Michigan | 8 |
| California | 5 |
Students from 44 countries are represented at this school, with the majority of the international students coming from Japan, China, and Vietnam.
Learn more about international students at North Central.
A traditional college student is defined as being between the ages of 18-21. At North Central, 75.31% of students fall into that category, compared to the national average of 60%.
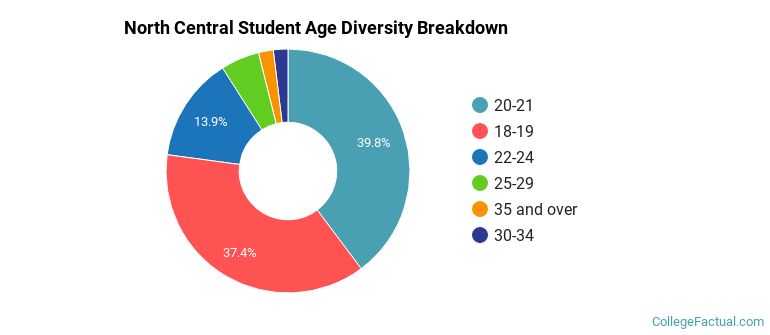
| Student Age Group | Amount |
|---|---|
| 20-21 | 1,151 |
| 18-19 | 1,082 |
| 22-24 | 401 |
| 25-29 | 148 |
| 35 and over | 57 |
| 30-34 | 56 |
| Under 18 | 0 |
Footnotes
*The racial-ethnic minorities count is calculated by taking the total number of students and subtracting white students, international students, and students whose race/ethnicity was unknown. This number is then divided by the total number of students at the school to obtain the racial-ethnic minorities percentage.
References
Department of Homeland Security Citizenship and Immigration Services
Find out how College Factual created their Diversity Rankings.